CHAPTER 1
THE INVENTION OF THE AVERAGE
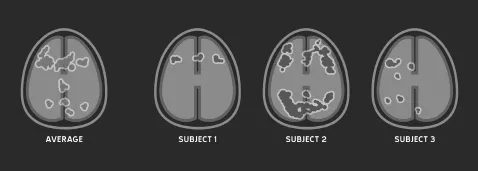
In 2002, UC Santa Barbara neuroscientist Michael Miller conducted a study of verbal memory. One by one, sixteen participants lay down in an fMRI brain scanner and were shown a set of words. After a rest period, a second series of words was presented and they pressed a button whenever they recognized a word from the first series. As each participant decided whether he had seen a particular word before, the machine scanned his brain and created a digital “map” of his brain’s activity. When Miller finished his experiment, he reported his findings the same way every neuroscientist does: by averaging together all the individual brain maps from his subjects to create a map of the Average Brain.1 Miller’s expectation was that this average map would reveal the neural circuits involved in verbal memory in the typical human brain.
Whenever you read about some new neuroscience discovery accompanied by a blob-splotched cross section of a brain—here are the regions that light up when you feel love; here are the regions that light up when you feel fear—it’s a near certainty that you are looking at a map of an Average Brain. As a graduate student, I was also taught the method of producing and analyzing the Average Brain (referred to as the “random effects model” in the jargon of science2) when I was trained in brain imaging at Massachusetts General Hospital. The driving assumption of this method is that the Average Brain represents the normal, typical brain, while each individual brain represents a variant of this normal brain—an assumption that mirrors the one that motivated the Norma look-alike contest. This premise leads neuroscientists to reject left-handed people from their studies (since it is presumed the brains of left-handed people are different from normal brains) or sometimes even throw out those individuals whose brain activity deviates too far from average, since researchers worry these outliers might cloud their view of the Average Brain.
There would have been nothing strange about Miller reporting the findings of his study by publishing his map of the Average Brain. What was strange was the fact that when Miller sat down to analyze his results, something made him decide to look more carefully at the individual maps of his research participants’ brains. Even though Miller was investigating a well-studied mental task using the standard method of brain research—and even though there was nothing unusual about his participants’ Average Brain—he glanced over a few of the individual maps. “It was pretty startling,” Miller told me. “Maybe if you scrunched up your eyes real tight, a couple of the individual maps looked like the average map. But most didn’t look like the average map at all.”3
Other people before Miller had noticed that individual brains often failed to resemble the Average Brain, but since everyone else ignored this awkward fact, they usually ignored it, too—just as scientists and physicians long ignored the fact that no real woman looked like Norma. But now Miller did something that might seem perfectly obvious to do, yet few had ever bothered to attempt: he systematically compared each of the sixteen individual brain maps from his verbal memory experiment to the map of the Average Brain. What he found astonished him. Not only was each person’s brain different from the average, they were all different from one another.
MIKE DICKS, DESCIENCE LIMITED
MEMORY ACTIVITY IN THE BRAIN
Some people’s brains were mostly activated on the left, others on the right. Some brains were mostly activated in the front, others in the back. Some looked like a map of Indonesia with long, thick archipelagos of activation; others were almost entirely blank. But there was no avoiding the most salient fact: nobody’s brain looked like the Average Brain. Miller’s results paralleled those obtained by Gilbert Daniels during his investigation of hands, except this time the organ being studied wasn’t a limb—it was the very cradle of thought, feeling, and personality.
Miller was bewildered. According to the key assumption behind the method of the Average Brain, most people’s brains should be fairly close to average. Neuroscientists certainly expected that some brains should be similar to the average. But hardly any of the brains in Miller’s study even remotely resembled the Average Brain. Miller feared that perhaps there had been some kind of technical error in his equipment, so he brought many of the same participants back a couple months later and once again scanned their brains as they performed the same word memory task. The results were nearly identical: each person’s new brain map was pretty close to his original brain map—and each individual brain map remained quite different from the map of the Average Brain.
“That convinced me that the individual patterns we were seeing was not random noise but something systematic about the way each individual performed the task, that each person’s memory system consisted of a unique neural pattern,” Miller explained to me. “But what was most surprising was that these differences in patterns were not subtle, they were extensive.”4
The “extensive” differences that Miller found in people’s brains aren’t limited to verbal memory. They’ve also been found in studies of everything from face perception and mental imagery to procedural learning and emotion.5 The implications are hard to ignore: if you build a theory about thought, perception, or personality based on the Average Brain, then you have likely built a theory that applies to no one. The guiding assumption of decades of neuroscience research is unfounded. There is no such thing as an Average Brain.
When Miller published his counterintuitive findings, at first they elicited skepticism. Some scientists suggested the findings might be due to problems with his software algorithms, or simply bad luck in his choice of subjects—maybe too many of his participants were “outliers.” The most common response from Miller’s colleagues, however, was not criticism, but bored dismissal. “Other people had noticed what I noticed before in their own work; they just shrugged it off,” Miller told me. “People were saying, ‘Everybody already knows this, it’s no big deal. That’s why you use the average, it takes all these individual differences into account. You don’t need to bother pointing out all this variability, because it doesn’t matter.’”6
But Miller was convinced it did matter. He knew this was not some academic debate, but a problem with practical consequences. “I’ve been approached by people working on the neuroscience of law,” Miller says. “They’re trying to make inferences they can use in a court of law about people’s psychiatric condition and mental states. They want to use brain scans to decide if someone should go to jail or not, so it most definitely matters if there’s a systematic difference between the individual brain and the ‘average’ brain.”7
Miller is not the only scientist to confront a field-shaking dilemma involving the use of averages. Every discipline that studies human beings has long relied on the same core method of research: put a group of people into some experimental condition, determine their average response to the condition, then use this average to formulate a general conclusion about all people. Biologists embraced a theory of the average cell, oncologists advocated treatments for the average cancer, and geneticists sought to identify the average genome. Following the theories and methods of science, our schools continue to evaluate individual students by comparing them to the average student and businesses evaluate individual job applicants and employees by comparing them to the average applicant and average employee. But if there is no such thing as an average body and there is no such thing as an average brain, this leads us to a crucial question: How did our society come to place such unquestioning faith in the idea of the average person?
The untold story of how our scientists, schools, and businesses all came to embrace the misguided notion of the “Average Man” begins in 1819, at the graduation of the most important scientist you have never heard of, a young Belgian by the name of Adolphe Quetelet.
THE MATHEMATICS OF SOCIETY
Quetelet (“Kettle-Lay”) was born in 1796. At age twenty-three he received the first doctorate in mathematics ever awarded by the University of Ghent. Smart and hungry for recognition, he wanted to make a name for himself like one of his heroes, Sir Isaac Newton. Quetelet marveled at the way Newton uncovered hidden laws governing the operation of the universe, extracting orderly principles out of the chaos of matter and time. Quetelet felt that his best chance for a similar achievement was in astronomy, the leading scientific discipline of his time.8
In the early nineteenth century, the most prominent scientific minds turned their attention to the heavens, and the greatest symbol of a nation’s scientific status was the possession of a telescopic observatory. Belgium, however, did not have one. In 1823, Quetelet somehow managed to convince the Dutch government that ruled Belgium to shell out the exorbitant sum needed to build an observatory in Brussels, and very soon Quetelet was appointed to its top position, director of the observatory.9 As the lengthy construction proceeded, Quetelet embarked on a series of visits to observatories throughout Europe to learn the latest observational methods. It seemed he had perfectly positioned himself to make an enviable run at scientific acclaim—but then, in 1830, just as he was wrapping up his tour of Europe, Quetelet received bad news: Belgium had plunged into revolution. The Brussels observatory was occupied by rebel troops.10
Quetelet had no idea how long the revolution would last, or whether the new government would support the completion of the observatory—or if it would even allow him to continue as Belgium’s “Astronomer Royale.” It would prove to be a turning point in his life—and in the way society conceived of individuals.11
Previously, Quetelet never cared much about politics or the complexities of interpersonal dynamics. He was solely focused on astronomy. He believed he could keep his distance from any social commotion, which he viewed as irrelevant to his lofty scientific endeavors. But when revolution erupted in his own backyard—in his own observatory—human social behavior suddenly became very personal. Quetelet found himself longing for a stable government that passed sensible laws and policies that would prevent the sort of social chaos that had derailed his career plans—and which seemed to keep leading to upheaval all around Europe. There was just one glaring problem: modern society seemed utterly unpredictable. Human behavior did not appear to follow any discernible rules . . . just like the universe had seemed so indecipherable before Isaac Newton.12
As he contemplated the revolution that had put an end to his professional ambitions, Quetelet was struck with inspiration: Might it be possible to develop a science for managing society? He had spent his life learning how to identify hidden patterns in the mysterious whirl of the celestial heavens. Couldn’t he use the same science to find hidden patterns in the apparent chaos of social behavior? Quetelet set himself a new goal. He would apply the methods of astronomy to the study of people. He would become the Isaac Newton of social physics.13
Fortunately for Quetelet, his decision to study social behavior came during a propitious moment in history. Europe was awash in the first tidal wave of “big data” in history, what one historian calls “an avalanche of printed numbers.”14 As nations started developing large-scale bureaucracies and militaries in the early nineteenth century, they began tabulating and publishing huge amounts of data about their citizenry, such as the number of births and deaths each month, the number of criminals incarcerated each year, and the number of incidences of disease in each city.15 This was the very inception of modern data collection, but nobody knew how to usefully interpret this hodgepodge of data. Most scientists of the time believed that human data was far too messy to analyze—until Quetelet decided to apply the mathematics of astronomy.
Quetelet knew that one common task for any eighteenth-century astronomer was to measure the speed of celestial objects. This task was accomplished by recording the length of time it took an object such as a planet, comet, or star to pass between two parallel lines etched onto the telescope glass. For example, if an astronomer wanted to calculate the speed of Saturn and make predictions about where it would appear in the future, he would start his pocket watch when he observed Saturn touch the first line, then stop the watch when it touched the second line.16
Astronomers quickly discovered this technique suffered from one major problem: if ten astronomers each attempted to measure the speed of the same object, they often obtained ten different measurements. If multiple observations resulted in multiple outcomes, how could scientists decide which one to use? Eventually, astronomers adopted an ingenious solution that was originally known as the “method of averages”17: all the individual measurements were combined together into a single “average measurement” which, according to the advocates of the method, more accurately estimated the true value of the measurement in question than any single observation.18
When Quetelet ventured to establish a social science, his most pivotal decision was borrowing astronomy’s method of averages and applying it to people. His decision would lead to a revolution in the way society thought of the individual.
THE AVERAGE MAN
In the early 1840s, Quetelet analyzed a data set published in an Edinburgh medical journal that listed the chest circumference, in inches, of 5,738 Scottish soldiers. This was one of the most important if uncelebrated studies of human beings in the annals of science. Quetelet added together each of the measurements, then divided the sum by the total number of soldiers. The result came out to just over thirty-nine and three-quarters inches—the average chest circumference of a Scottish soldier. This number represented one of the very first times a scientist had calculated the average of any human feature.19 But it was not Quetelet’s arithmetic that was history making, it was his answer to a rather simple-seeming question: What, precisely, did this average actually mean...