Project economic analysis is a tool used by the Asian Development Bank (ADB) to ensure that ADB operations comply with its Charter. The guidelines in this publication are a revised version of the 1997 edition. The revision responds to the changing development context and ADB operational priorities, and aims to address the recommendations of the ADB Quality-at-Entry Assessments for more methodological work on project economic analysis. The revised guidelines provide general principles for the conduct of project economic analysis, and should be read together with handbooks, technical reports, and other reference materials published by ADB dealing with sector-specific project economic analysis in detail.
- 168 pages
- English
- ePUB (mobile friendly)
- Available on iOS & Android
eBook - ePub
About this book
Trusted by 375,005 students
Access to over 1.5 million titles for a fair monthly price.
Study more efficiently using our study tools.
Information
Appendix 1: Reference Materials on Project Economic Analysis in ADB
The following is a list of reference materials produced by ADB on project economic analysis. These are available at MyADB (internal website) and www.adb.org (external website).
1. Guidelines and Practical Guide
a. Guidelines for Economic Analysis of Projects, 1987
b. Guidelines for Economic Analysis of Projects, 1997
c. Economic Analysis of Policy-Based Operations: Key Dimensions, 2003
d. Cost-Benefit Analysis for Development: A Practical Guide, 2013
2. Pamphlets
a. Economic Analysis of Projects: Key Questions for Consultants, 1997
b. Key Areas of Economic Analysis of Projects: An Overview, 2004
c. Key Areas of Economic Analysis of Investment Projects: An Overview, 2013
3. Handbooks
a. Framework and Criteria for the Appraisal and Socioeconomic Justification of Education Projects, 1994
b. Framework for the Economic and Financial Appraisal of Urban Development Sector Projects, 1994
c. Handbook of Economic Analysis of Water Supply Projects, 1999
d. Handbook of Economic Analysis of Health Sector Projects, 2000
e. Handbook for Integrating Poverty Impact Assessment in the Economic Analysis of Projects, 2001
f. Handbook for Integrating Risk Analysis in the Economic Analysis of Projects, 2002
4. Technical Notes
a. Public Investment Criteria: Economic Internal Rate of Return and Equalizing Discount Rate, 1987
b. Public Investment Criteria: Financial and Economic Internal Rates of Return, 1990
c. Economic Analysis of Health Sector Projects: A Review of Issues, Methods, and Approaches, 1999
d. Economic Analysis of Subregional Projects, 1999
e. Contingency Calculations for Environmental Impacts with Unknown Monetary Values, February 2002
f. Integrating Risk into ADB’s Economic Analysis of Projects, June 2002
g. Economic Issues in the Design and Analysis of a Wastewater Treatment Project, July 2002
h. Measuring Willingness to Pay for Electricity, July 2002
i. Economic Analysis of Health Projects: A Case Study in Cambodia, July 2002
j. An Analysis and Case Study of the Role of Environmental Economics at the Asian Development Bank, September 2002
k. Shadow Exchange Rates for Project Economic Analysis: Toward Improving Practice at the Asian Development Bank, February 2005
l. Improving the Relevance and Feasibility of Agriculture and Rural Development Operations: How Economic Analyses Can Help, September 2005
m. Assessing the Use of Project Distribution and Poverty Impact Analyses at the Asian Development Bank, October 2005
n. Assessing Aid for a Sector Development Plan: Economic Analysis of a Sector Loan, November 2005
o. Setting User Charges for Urban Water Supply: A Case Study of the Metropolitan Cebu Water District in the Philippines, June 2006
p. Willingness-to-Pay and Design of Water Supply and Sanitation Projects: A Case Study, December 2006
q. Tourism for Pro-Poor and Sustainable Growth: Economic Analysis of Tourism Projects, January 2007
r. Good Practices for Estimating Reliable Willingness-to-Pay Values in the Water Supply and Sanitation Sector, December 2007
s. Utility Tariff Setting for Economic Efficiency and Financial Sustainability: A Review, August 2008
Appendix 2: Use of Constant Prices in the Economic Analysis of Projects
1. Project economic analysis is conducted using constant prices (also termed real prices). Constant prices are current prices (also termed nominal prices) adjusted for the effect of general inflation, assuming that inflation will affect prices of all project inputs and outputs equally. Using constant prices ensures that the future costs and benefits of a project are comparable to those incurred at the time the decision to invest in the project is made.
2. Table A2 compares constant and current price projections for a set of commodities. For traded items, the appropriate measure of inflation to adopt in adjusting current to constant prices is a measure of international inflation, such as the manufacturing unit value (MUV) index either of a single country, such as the United States, or an average of a number of countries. For nontraded items, an appropriate measure of inflation is the projected rate of increase in domestic prices, which can be a gross domestic product deflator, general consumer price index, or a more specific index such as a construction price index for construction costs.
Table A2: Commodity Price Projections in Current and Constant Prices
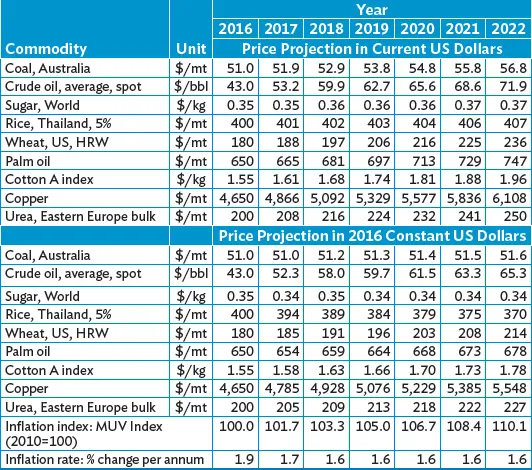
bbl = barrel, HRW = hard red winter, kg = kilogram, mt = metric ton, MUV = manufacturing unit value, US = United States.
Notes:
1. Crude oil, average price of Brent Dubai and West Texas, Intermediate, equally weighed.
2. MUV is the unit value index in US dollar terms of manufactures exported from 15 countries: Brazil, Canada, the People’s Republic of China, Germany, France, India, Italy, Japan, Mexico, the Republic of Korea, South Africa, Spain, Thailand, the United kingdom, and the US.
Source: World Bank. 2016. Commodity Markets Outlook. 26 July.
3. The use of constant prices removes the effects of general price increases. But it is possible that the relative prices of inputs and outputs could also change over time because of changes in productivity, technology, or demand. The price of a good may increase either slower or faster than the prices of other inputs and outputs, or vice versa. Expected changes in relative prices must also be reflected in project economic analysis.
4. Suppose a 2.5% annual increase of nominal wages for unskilled labor over 5 years is expected, when the annual general price increase for the same period is projected at 12% per year—the change in the relative price of unskilled labor will be given by (1 + 0.025) / (1 + 0.120) – 1 = –0.085, or –8.5%. Therefore, the value of unskilled labor in constant prices should be reduced by 8.5% per year over the 5-year period. Alternatively, suppose there is a scarcity of skilled labor and wages are expected to increase by 15% per year for 5 years—if inflation is assumed at 12% per annum for the same period, then the price of scarce labor used in the analysis should be increased by 2.7% per year for 5 years, calculated from (1 + 0.15) / (1 + 0.12) – 1 = 0.027, or 2.7%.
Appendix 3: Method for Constructing a Project Statement
1. A project statement presents project economic costs and benefits in constant prices, and it provides a useful tool for project economic analysis. The statement can be drawn up for each subproject, each project alternative, and a project as a whole. The whole project statement will cover the implementation period of major investments and operating years. The number of operating years to be covered in the statement can be determined by
a. the technical life of the major investment assets, that is, the number of years of normal operation before the assets are fully worn out; or
b. the economic life of the same assets—the number of years after which annual operation and maintenance costs exceed annual gross benefits.
2. Normally, the shorter of the two definitions of project life should be used. For some major economic infrastructure projects with particularly long lives, such as dams or railways, the project period may include 20–25 years of operation with the remaining life of assets represented by a residual value.
A. Investment Costs
3. Investment costs include initial investments to implement the project, replacement investments during the life of the project, and the residual value of investment assets at the end of the project. Initial investments are generally broken down into subcategories, such as land preparation, buildings and construction, equipment, vehicles, and other costs included in the initial investments such as environmental mitigation and monitoring. Physical contingencies included in the initial investments for economic analysis should be allocated to these different categories. The initial investments may be concentrated in a single project year, but are usually scheduled over more than 1 year according to the project phasing and implementation schedule.
4. Associated with each subcategory of investment is a replacement period in years. On the assumption of normal maintenance activities, this replacement period indicates when the relevant assets will be worn out and will therefore need replacing. Typically, replacement investments, if required by design, are entered in the project statement in the last year of use of the current assets, when commitments to new resources have to be made. Different types of investment assets have different replacement periods.
5. For whatever project period is decided upon, some assets will not be fully worn out at the end of the project period. The remaining value of the assets—their residual value—is entered as a negative investment cost at the end of the project. It can be calculated as the proportion of the replacement period still remaining for a particular subcategory, times the constant price value of the assets concerned.
6. Table A3, Item A, illustrates the construction of an investment schedule for a processing project with an implementation period of 2 years and an operating period of 20 years based on the estimated project life. It includes the initial investments, the replacement investments at intervals, and the residual values of project assets at the end of the project life.
Table A3: Project Statement (in constant economic prices)
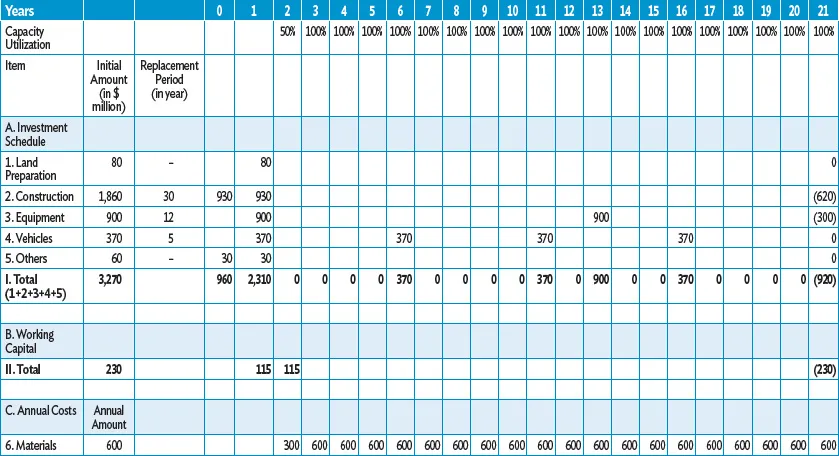
( ) = negative.
Source: ADB Economic Research and Regional Cooperation Department.
B. working Capital
7. The processing project holds large initial stocks of raw materials at some times of the year, and no initial stocks at others. The supply is seasonal. An annual average amount for initial stocks and final stocks of output is included in Table A3, Item B, related to the capacity utilization of the assets. A residual value is included at the end of the project life. A more detailed treatment of working capital in project statements is illustrated in Appendix 6.
C. Annual benefits and Costs
8. The supply of raw materials for the processing project builds up over 2 years from the end of implementation. Capacity utilization is 50% in the first operating year, and then 100% thereafter. Most annual costs (materials, utilities, and labor) are variable and increase with capacity utilization. Overhead costs are fixed. The annual costs include an estimate for the opportunity cost of land; half the land is taken over in the first implementation year, and the other half in the second year of implementation. The annual costs are totaled for each yea...
Table of contents
- Front Cover
- Title Page
- Copyright Page
- Contents
- Tables and Figures
- Foreword
- Acknowledgments
- Abbreviations
- I. Introduction
- II. Scope of Project Economic Analysis
- III. Identification of Project Benefits and Costs
- IV. Economic Valuation of Benefits and Costs
- V. Benefit Valuation in Different Sectors
- VI. Investment Decisions and Criteria
- VII. Sensitivity and Risk Analysis
- VIII. Project Sustainability
- IX. Distribution Analysis
- Appendixes: 1 Reference Materials on Project Economic Analysis in ADB
- 2 Use of Constant Prices in the Economic Analysis of Projects
- 3 Method for Constructing a Project Statement
- 4 Consumer Surplus and Gross Project Economic Benefits
- 5 Methods for Valuing Nonmarket Impacts
- 6 Treatment of Working Capital
- 7 Examples of Deriving Economic Prices
- 8 Illustrations of Estimating the Shadow Wage Rate
- 9 Economic Price of Land and Treatment of Resettlement
- 10 Depletion Premium
- 11 Use of Domestic Price Numeraire
- 12 Illustration of Estimating the Shadow Exchange Rate
- 13 Using Conversion Factors: A Water Project Example
- 14 Examples of Benefit Transfer Method
- 15 Distribution Analysis of Regional Cooperation Projects
- 16 Estimating the Economic Rate of Return: Irrigation Rehabilitation Project
- 17 Illustration of Least-Cost and Cost-Effectiveness Analysis
- 18 Estimating the National Economic Discount Rate
- 19 Treatment of Uncertainty: Sensitivity and Risk Analysis
- 20 Distribution of Project Effects
- Footnotes
- Back Cover
Frequently asked questions
Yes, you can cancel anytime from the Subscription tab in your account settings on the Perlego website. Your subscription will stay active until the end of your current billing period. Learn how to cancel your subscription
No, books cannot be downloaded as external files, such as PDFs, for use outside of Perlego. However, you can download books within the Perlego app for offline reading on mobile or tablet. Learn how to download books offline
Perlego offers two plans: Essential and Complete
- Essential is ideal for learners and professionals who enjoy exploring a wide range of subjects. Access the Essential Library with 800,000+ trusted titles and best-sellers across business, personal growth, and the humanities. Includes unlimited reading time and Standard Read Aloud voice.
- Complete: Perfect for advanced learners and researchers needing full, unrestricted access. Unlock 1.5M+ books across hundreds of subjects, including academic and specialized titles. The Complete Plan also includes advanced features like Premium Read Aloud and Research Assistant.
We are an online textbook subscription service, where you can get access to an entire online library for less than the price of a single book per month. With over 1.5 million books across 990+ topics, we’ve got you covered! Learn about our mission
Look out for the read-aloud symbol on your next book to see if you can listen to it. The read-aloud tool reads text aloud for you, highlighting the text as it is being read. You can pause it, speed it up and slow it down. Learn more about Read Aloud
Yes! You can use the Perlego app on both iOS and Android devices to read anytime, anywhere — even offline. Perfect for commutes or when you’re on the go.
Please note we cannot support devices running on iOS 13 and Android 7 or earlier. Learn more about using the app
Please note we cannot support devices running on iOS 13 and Android 7 or earlier. Learn more about using the app
Yes, you can access Guidelines for the Economic Analysis of Projects by in PDF and/or ePUB format, as well as other popular books in Business & Business Strategy. We have over 1.5 million books available in our catalogue for you to explore.