
eBook - ePub
Living on the Fault Line, Revised Edition
Managing for Shareholder Value in Any Economy
- 304 pages
- English
- ePUB (mobile friendly)
- Available on iOS & Android
eBook - ePub
Living on the Fault Line, Revised Edition
Managing for Shareholder Value in Any Economy
Trusted by 375,005 students
Access to over 1.5 million titles for a fair monthly price.
Study more efficiently using our study tools.
Information
Subtopic
Business GeneralIndex
BusinessI
THE INVESTOR PERSPECTIVE
Management must serve four primary constituencies in a capitalist system: customers, partners, employees, and investors. Of these, investors have the least visible presence, yet their influence is both deep and pervasive. Without investment capital and equity liquidity, companies cannot transcend the limits of local, owner-operated businesses.
Thus we embrace investors—often, however, without fully understanding their motives. Too often indeed we learn about these motives in the negative sense, when we violate unspoken covenants and expectations, leading to a deteriorating stock price and plummeting market capitalization, accompanied by loss of marketplace prestige and acquisition currency. The sad part of all this is that investor perspective is a hugely useful guide to management decision-making both in good times and bad, and keeping it in view is critical to navigating the uncertain waters of technology-enabled markets.
The key notion we will explore in this chapter is simple: investors are always looking for your company’s future prospects to brighten. That is, when they sell, they want the buying investor to see a brighter prospect than they did back when they bought. That, and only that, raises the value of your stock and creates a positive return for their investment. When they judge your company and your executive performance, all your decisions will be filtered through this lens: are you brightening the prospects?
From a management point of view, this means that investors want your company to become more powerful under your watch. Increasing power—not revenue, not earnings, not dividends—is what increases stock price. Conversely, any action that diminishes power will sooner or later result in disappointing investors. Stock price tracks to investor perceptions around this issue. Thus it is that stock price over time acts as an information system to management about marketplace power. It is a grade on your strategy and execution, and if you learn to use it as such, you can improve your team’s performance as well as create a powerful equity-based war chest for future growth in power.
STOCK PRICE AS AN INFORMATION SYSTEM
Stock price is a consequence of an impersonal force—investment—supplying capital to the sources of greatest risk-adjusted return. Investors in the aggregate are representatives of that force. As such they will never lie. They may get confused in the short term, but as soon as the true lay of the land comes clear, they will adjust their investments accordingly. In other words, you can trust investment to be unflaggingly self-interested.
More importantly, however, you can trust investment to be right. To be sure, as individuals, investors are often wrong, but collectively over time, they cannot be. That is, because investing is an inherently Darwinian exercise, poor investors lose capital and lose the ability to raise more, whereas good investors increase the capital they have under management and get pressed into investing additional capital as well. Over time capital ends up in the hands of those fittest to generate more capital. (As a society we may choose to enforce redistribution of that capital—that’s a decision that lies outside the purview of this book—but regardless of that decision, it is in everyone’s interest first to accumulate it.)
These successful investors pursue a single, simple end: to gain the best risk-adjusted return on capital they can. As we shall explain in more detail shortly, this is primarily a function of investing in entities that demonstrate the strongest competitive advantage in the markets they serve. Capital, in other words, flows to competitive advantage and abandons competitive disadvantage.
Your stock price is a measure of your attractiveness as an investment destination. Day to day, or even month to month, it is subject to so many distorting effects that it is virtually impossible to extract a meaningful signal from all the noise. But over time the effects of random noise cancel out, and a reliable signal does emerge. This long-term “noise-free” price establishes your “normal” market capitalization, a valuation by the investment community of your future earnings prospects relative to all the other sources of investment available. Even in the short term, although the absolute value of your market cap may be distorted, your valuation relative to your direct competitors is not likely to be. That is, if you rank companies in a given sector by market cap, you will almost always be ranking them by competitive advantage status.
Now when we are on the winning end of this exchange, we like to praise the wisdom of our shareholders for seeing our true value. When we are on the losing end, on the other hand, we are more likely to grouse about disloyal or impatient investors who are too short-term in their orientation. Neither reaction, however, is truly appropriate because both personalize the transaction. It is not personal. Capital is like water—it does not flow uphill against the gravity of competitive advantage. It can be pumped uphill, to be sure—that is what governments do all the time—but that is not its natural tendency. Therefore, wherever capital is allowed to follow its natural course, you can count on it to point out where competitive advantage lies.
This has huge implications for all kinds of executive decisions. Because stock price is in effect an information system about competitive advantage, it can help you sort through which markets to attack, which strategies to pursue, which partners to endorse, and which tactics to execute. It can teach you to abandon the familiar and embrace the strange—or vice versa. It can tell you where to invest and where to divest—or to put it in Kenny Rogers’s vernacular, it can let you “know when to hold ’em and know when to fold ’em.”
Capital in this sense functions like a canary in a coal mine. It is often your best leading indicator about your future competitive advantage as well as that of your partners and your competitors. It is thus a great counselor. Now to be sure, there are times when true leaders, like great chess players, choose to go against the wisdom of others and disregard the advice of counsel. It is not the goal of this book to make you or your company a slave to capital’s dictates, particularly given the noisy environment in which they are communicated. But it is a goal that you should learn how to take counsel from capital markets, and to that end, the first step is learning how to decode stock price, beginning with your own.
1
UNDERSTANDING
SHAREHOLDER VALUE
What is a share of your stock worth? By definition a share entitles its owner to a percentage of the future returns of your business. Owning all the stock in your company would entitle one to 100 percent of all your future earnings forever. What, exactly, should that be worth? And how would or could one know?
The challenge lies in the word future—how to value what is essentially a bird in the bush, not a bird in the hand. Investors and analysts must find some way to understand your business and its future trajectory so that, at any given price, they can decide whether to buy, sell, or hold your stock.
This has led to something of a consensus around the following as the fundamental valuation formula:
The total value of a company, its market capitalization, is equal to the present value of its forecastable future earnings from current and planned operations, discounted for risk.
Let’s parse this sentence one phrase at a time. We’re interested in the present value because the initial competition for all investment is cash—investors keeping their cash in hand and not parting with it to anyone. How much of this cash in hand today is your company really worth? Only a buyer and a seller agreeing to trade shares for cash at a given price can truly testify to that amount, with each new trade bearing witness to a new act of valuation. The stock market continuously reports on the fluctuations in this ongoing stream of cash-equivalent valuations in the form of a running series of stock price quotes. Multiplying any given quote by the number of shares outstanding, you can calculate your company’s current total value, or market capitalization, at any time.
The price of the last trade sets the historical value for your company. It is a benchmark for the next trade, but it does not set the value of that trade. Instead, future considerations do. Specifically investors focus on forecastable future earnings for the following reasons:
- It is earnings, not revenues, that are tracked because that is what an investor is entitled to a share of. *
- They are future earnings because investors are not entitled to past earnings, only those coming up. When these earnings move from a future promise to a present achieved reality, they can either be distributed to investors in the form of some kind of a dividend or they can be reinvested in the company. If they are reinvested, the investor defers their reward in hopes of future additional earnings that such reinvestment might generate.
- And finally, they must be forecastable earnings because investors need some current foundation for incorporating the future into their present calculations.
Forecastability is fundamental to investability in that the higher the probability of the forecast, the lower the risk of investment. Companies with high forecastability are typically market leaders in robust markets, such as IBM in enterprise systems, Microsoft in PC software, and Intel in microprocessors. When a company is a market leader in a weak market, such as American Airlines or United Airlines, or when they are in a strong market but not the market leader, such as Motorola or Ericsson in the mobile phone handset market, then forecastability becomes a much greater challenge, and stock price suffers.
The forecastable future earnings investors focus on must come from the company’s ongoing current and planned operations. That is, although investors are entitled to a percentage of any bonanza earnings the company gets—say by finding gold on its corporate site or, more likely, by investing in a strategic partner whose stock subsequently appreciates—they have no practical basis for incorporating the chance of such gains into their valuation of the stock. Thus, although Adobe made over $300 million when it sold its investment in Netscape, the windfall had no appreciable impact on its stock. Moreover, although a company can indeed create earnings outside of operations—say, via the actions of its corporate treasury, by investing in derivatives, for example—it will not please its investors by so doing because it is inherently changing the risk to which the earnings stream is exposed. Indeed, in the 1990s the CFO of Dell Computers was taken to task precisely for such actions. If investors want to take derivative risk, they would like do so on their own time; they don’t want someone else to do it for them.
And that leads directly to the last phrase, discounted for risk. This discount is what compensates investors for the use of their capital. After all, in committing their capital to your company, investors are taking a risk that it may be consumed without a return, or that it may generate a substandard return, or that had they invested it somewhere else they could have earned a better return. You pay for that risk by promising to return them more money than they invest. The question is, how much of a premium would be fair?
Risk is the true wild card in all investment decisions. It can never be known, only probabilistically assigned. Moreover, perceived risk changes dynamically with new information about any of the myriad of variables incorporated in its view. So rather than try to calculate it, free markets use the mechanism of many investors buying and selling to let the price seek its own level. That is why the stock market is so jittery. It is continually rebalancing its equations to account for streams of information that may have bearing on risk. The market does this not through some grand mathematics but rather through the simple expedient of free exchanges, some right, some wrong, but all having the effect of automatically rebuilding the new equation. We may never be able to write this equation down, but with the ticker tape we have its output before us at all times.
To recap then, your market capitalization is equal to the present value of your company’s forecastable future earnings from current and planned operations, discounted for risk. That’s the definition, if you will. But it is one thing to define a concept and another to really get it. To really get shareholder value, I think you have to visualize it.
VISUALIZING SHAREHOLDER VALUE
To put all the foregoing words into a single picture, consider the following figure:
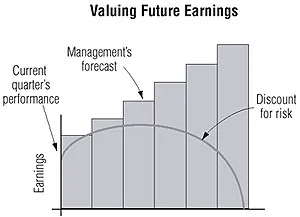
Figure 1.1
The Y-axis in this graph represents earnings. It is benchmarked by the operation’s latest earnings report—that sets the value of Y on the left side of the curve. The X-axis represents future time. The bars represent management’s forecast of future earnings over the next several years. The curve represents an investment analyst’s attempt to discount management’s forecast to incorporate appropriate risk.
Every quarter this graph gets redrawn based on a new benchmark and a new forecast. That is, you can think of each of the bars shifting one space to the left, the leftmost bar now being replaced by the new quarterly report, and a new bar appearing on the right representing a future quarter just coming into view. This results in the projection of a new curve, representing a revised assessment of the present value of future returns discounted for risk.
Any point on the curve is to some degree speculative, and the farther out to the right it is, the more speculative it becomes. That is, earnings forecasts near to the Y-axis tend to track closely to management’s guidance. That is because sales pipelines, work-in-process, and backlog all help make the next few quarters more visible and predictable. As a result, this part of the curve is not subject to significant discount for risk unless management’s credibility is at stake.
Farther out on the curve, however, it is a different story. Forecasts that extend beyond the sales pipeline are necessarily little more than extrapolations of investments and trends. The risk in these forecasts increases directly with time, and thus the discount for risk must also increase over time as well. Thus, even though future earnings forecasts increase indefinitely, the present value placed on them decreases. Eventually this value is set to zero—at the far right of the curve where it meets the X-axis—meaning that beyond this point in time no forecasts of any size will alter the valuation investors are willing to support.
Each unit of time on the X-axis, therefore, implies an increasingly larger discount rate applied to management’s forecast. Where X = 0, the discount rate = 100%, because that’s the quarterly report’s figure and that money is in the bank. Where Y = 0, the discount rate = 0%, meaning no promise has value regardless of size. At every point in between, the effective discount rate is set at some intermediate value by the judgment of the investor or investment analyst.
Now let’s assume for the moment that this operation we are forecasting represents the total revenue stream of the company. This would be the case for a one-product, one-division enterprise. In that case we could make the following claim: The area under the curve represents this company’s market capitalization.
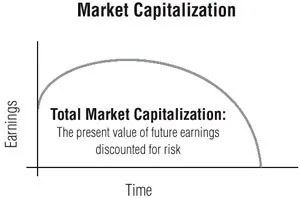
Figure 1.2
That is, the area under the curve is a direct visualization of the present value of forecastable future earnings from current and planned operations discounted for risk. This is the pie that investors are buying a piece of. A share of stock, therefore, is valued as a percentage of this pie.
Now let’s stop for a moment.
While there are still a number of additional modifications needed to make this figure actually correspond to any real-world situation, we can make one key point using the market capitalization figure simply as it stands. The job of the executive team of any corporation from an investor’s point of view is to grow the area under this curve. Period. So how would you do that?
CREATING SHAREHOLDER VALUE
To enlarge the area under the curve you must move the curve itself either up or to the right. Effectively this means:
- Make the forecastable earnings line go higher, or
- Make the forecastable earnings line extend out farther, or better still
- Do both.
In all these cases you are in effect creating that brighter future investors seek.
Now, it is not hard to do this in a presentation. PowerPoint is particularly good at making small areas bigger. The critical issue is how to manage this change in the real world. And the way to do that, quite simply, is to increase your competitive advantage in your target markets:
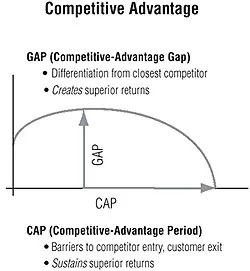
Figure 1.3
Competitive advantage has two dimensions—somewhat analogous to space and time. The dimension that corresponds to space has to do with the competitive-advantage gap, or just GAP for short. This is the distance (metaphorically) between your company’s offerings and those of your closest competitors. It is a function of differentiation. You can increase this distance by any number of tactics—coming out with a new product, cost-reducing a current offering, building a coalition to add value to your existing offers, enhancing the service component of your current offer, or the like. When you do this, and your competitors do not, you increase the value gap between your offer and theirs.
Improving GAP shows up primarily on the vertical axis because it directly impacts both sales revenues and gross margins. That is, a larger GAP allows your company’s offer to win a greater share of sales away from your competition, or it allows it to earn a higher price premium than it did before, or in many cases, both. Such increases in sales volume and gross margins, assuming they are made within your existing cost structure, go straight to the bottom line to create increased earnings, thereby pushing the curve higher on the Y-axis.
Competing on GAP is familiar to all management teams. Every time Ford introduces a new car, J.Crew a new line of shirts, or Compaq a new computer, they are competing on GAP. Every time your company rolls out a price promotion, adds a new feature, or cost-reduces a component assembly, it is competing on GAP. The intent in every case is to increase competitive advantage in the short term by differentiating the offer. Managers get it, investors get it, and we are all on the same page. The Y-axis, in sum,...
Table of contents
- Dedication
- Contents
- Preface
- Part I
- Part II
- Part III
- Part IV
- Part V
- Part VI
- Epilogue
- Acknowledgements
- About the Author
- Also by Geoffrey A. Moore
- Copyright
- About the Publisher
Frequently asked questions
Yes, you can cancel anytime from the Subscription tab in your account settings on the Perlego website. Your subscription will stay active until the end of your current billing period. Learn how to cancel your subscription
No, books cannot be downloaded as external files, such as PDFs, for use outside of Perlego. However, you can download books within the Perlego app for offline reading on mobile or tablet. Learn how to download books offline
Perlego offers two plans: Essential and Complete
- Essential is ideal for learners and professionals who enjoy exploring a wide range of subjects. Access the Essential Library with 800,000+ trusted titles and best-sellers across business, personal growth, and the humanities. Includes unlimited reading time and Standard Read Aloud voice.
- Complete: Perfect for advanced learners and researchers needing full, unrestricted access. Unlock 1.5M+ books across hundreds of subjects, including academic and specialized titles. The Complete Plan also includes advanced features like Premium Read Aloud and Research Assistant.
We are an online textbook subscription service, where you can get access to an entire online library for less than the price of a single book per month. With over 1.5 million books across 990+ topics, we’ve got you covered! Learn about our mission
Look out for the read-aloud symbol on your next book to see if you can listen to it. The read-aloud tool reads text aloud for you, highlighting the text as it is being read. You can pause it, speed it up and slow it down. Learn more about Read Aloud
Yes! You can use the Perlego app on both iOS and Android devices to read anytime, anywhere — even offline. Perfect for commutes or when you’re on the go.
Please note we cannot support devices running on iOS 13 and Android 7 or earlier. Learn more about using the app
Please note we cannot support devices running on iOS 13 and Android 7 or earlier. Learn more about using the app
Yes, you can access Living on the Fault Line, Revised Edition by Geoffrey A. Moore in PDF and/or ePUB format, as well as other popular books in Business & Business General. We have over 1.5 million books available in our catalogue for you to explore.