![]()
Josefino C. Comiso
1 Variability and trends of global sea ice cover and sea level: effects on physicochemical parameters
1.1 Introduction
The rapid decline in the Arctic summer ice cover minimum and the acceleration of sea level rise, as reported in recent years [1–3], have gained a great deal of attention and are regarded as among the most visible signals of anthropogenic global warming. Both phenomena have been linked to climate change either directly or indirectly and are expected to cause profound changes in the physicochemical characteristics of the polar and extrapolar regions. Historically, the high latitude regions have received little interest mainly because of general inaccessibility, harsh weather conditions and the paucity of data. The advent of satellite remote sensing has completely changed this, and our ability to monitor polar regions and especially sea ice cover, other components of the cryosphere and sea level rise has been vastly improved. In particular, polar orbiting satellite data have yielded more than 3 decades of consistent and continuous global data sets at a temporal resolution of even better than twice daily. But more importantly, the data have yielded strong evidence that dramatic changes related to climate are occurring in the polar regions.
The yearly Arctic summer ice cover minimum has been studied and used to indicate that the perennial ice cover has been rapidly declining – even with only approximately 22 years (i.e. 1978 to 2000) of satellite data [4]. By perennial ice, we mean the thick ice type that normally survives the spring and summer melt. It is the mainstay of the Arctic sea ice cover and is known to have been in existence for at least 1450 years [5]. Following a dramatic decline in the Arctic summer sea ice cover in 2007 [1], the extent of the perennial ice was a record low in 2012 [6] and was found to be less than half of its extents observed in the 1980s. This has led to a realization that the Arctic region has been changing fast; this has ignited many international and national research projects in the region. While a sea ice cover decline has been expected from modeling studies, the rate of decline as projected by the models is significantly less than that actually observed from satellite data [7]. This means that there are still gaps in our knowledge of the physics of the Arctic climate system. The observed decline is consistent with the amplification of global warming in the Arctic by more than 3 times as has been reported [8]. Such amplification is in part the result of a phenomenon called “ice-albedo feedback” that is associated with the decline of the summer ice cover [9]. Such warming has affected the rest of the cryosphere in the region, including the glaciers in North America and the vast ice sheet of Greenland [10]; the latter has a sea level equivalence of greater than seven meters.
The observed physical changes in the Southern Hemisphere is different from those in the Arctic and appear counterintuitive but not totally unexpected, considering that the impact of global warming around the globe is not uniform [11]. Sea ice cover is observed to be expanding and some cooling is observed in large areas of the Antarctic region [12,13]. Quantitative estimates of the rate of loss of mass observed due to melting of the massive ice sheet in Antarctica, which has a sea level equivalence of more than 60 meters, are also of interest, but results from different investigators have been inconsistent [10].
In this chapter, an overview of the current state of the global sea ice cover, changes in surface temperature, related rise in sea level and associated changes in the physicochemical characteristics of the marine environment and global climate will be presented. Sea ice is already a part of the ocean and causes a negligible increase in sea water level when it melts. However, the loss of sea ice in recent years, especially in the spring and summer, has contributed to the aforementioned amplified warming in the Arctic that in turn has caused more land ice to melt and thus a higher rate of sea level rise. It will likely cause a change in the primary productivity of the region as well.
The direct impacts of changes in the global sea ice cover on the physicochemical characteristics of the affected regions are expected to be profound, but specific details are basically unknown and still the subject of many modeling and observational studies. Most studies focus on the impact of climate change in general on marine ecosystems [14], but the impact on polar marine ecosystems has become the subject of strong interest because of the rapidly retreating Arctic ice cover [15]. A significant increase in sea level is expected to cause serious negative changes on the global marine ecosystem, but most studies concentrate mainly on impacts that primarily occur in coastal regions [16] where the effects are most visible.
Because of rapid changes in the polar environment in recent years, this study will make use of results from updated data sets to take advantage of an extended data record to provide an interpretation of the observed phenomena that is as accurate as possible. This will thereby enhance our current understanding of the physics of the system. The use of updated data also allows for an assessment of previous forecasts’ accuracy that relied on numerical models or statistical studies.
1.2 Variability and trends of global sea ice
The sea ice cover has been considered a key component of the Earth’s climate system. Because of its high albedo and good thermal insulating property, it is very effective in limiting heat and salinity fluxes between the ocean and the atmosphere. Sea ice also redistributes surface salinity and alters surface density; this causes vertical circulation that enables upper layers of the oceans to be replenished with nutrients, oxygen and other chemicals. The ice-covered regions make up three of only four regions where deep ocean convection has been observed worldwide. They have also been the primary source of bottom water that is an essential component of global ocean thermohaline circulation. Latent heat and sensible heat polynyas are also formed in ice-covered regions; this causes an alteration in the physical and chemical properties of the ocean[17]. Sea ice melt in the spring and summer also causes the formation of a stable melt surface layer that is exposed to abundant sunlight and serves as a platform for efficient photosynthesis. This phenomenon makes the region a site for phytoplankton blooms and high primary productivity during the spring and summer [18]. Sea ice also covers a large fraction (about 6%) of the global oceans and can affect shipping, fisheries and mineral exploration.
Among the most important tools that have been used to study the large-scale characteristics, variability and trends of global sea ice cover are satellite passive microwave sensors. The first imaging system was the Nimbus-5/ESMR that was launched in December 1972 and was the first to reveal the true extent and variability of global sea ice cover at a temporal resolution of about 3 days. Because of the large contrast in the brightness temperature of sea ice-covered and ice-free ocean, the sensor was able to provide the extent and general characteristics of the sea ice cover [19]. However, with only one channel available at 19 GHz and horizontal polarization, the data could only provide rough estimates of the ice concentration within the pack because of varying surface emissivity associated with different ice types and snow cover conditions. Accurate, consistent and continuous monitoring of sea ice cover started with the Nimbus-7 Scanning Multichannel Microwave Radiometer (SMMR) which was launched in October 1978 and was succeeded by a series of the DMSP/Special Scanning Microwave Imager (SSM/I) that started in July 1987 and continued up to the present. The two sensors are both dual polarized, multi-frequency and conically scanning systems for consistent coverage of the surface at a resolution of about 25 km. An even more capable system called AMSR-E was launched on board the EOS/Aqua satellite in May 2002; it provides more accurate brightness temperature data at a significantly higher resolution [20]. AMSR-E provided high quality sea ice data until it suffered instrumental problems and was turned off in 2011. It was succeeded by AMSR-2, which was launched on board GCOM-W by JAXA in 2012.
Analyses of time series of sea ice data from various passive microwave sensors have been reported in several publications [12, 13, 21–24]. Different techniques were used to retrieve sea ice concentrations and therefore ice extent and ice area. However, the results on seasonal and inter-annual variability of sea ice have been generally consistent [21,22]. The trends reported for different time periods are generally different – albeit slightly – because of the relatively short record length and the large inter-annual variability of ice cover.
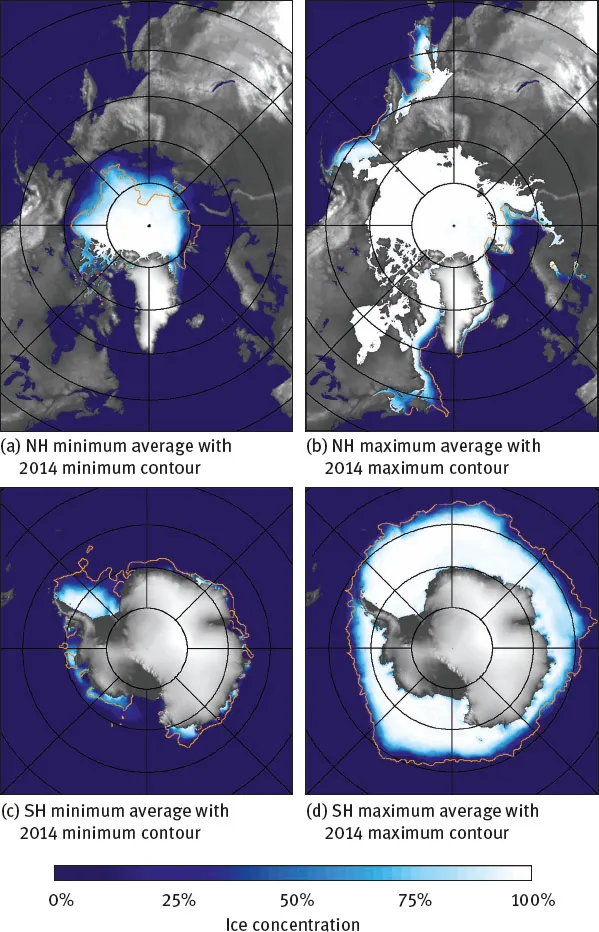
Color-coded maps of ice concentration averages during maximum and minimum extents for each year since November 1978 are presented in Fig. 1.1. Because of large inter-annual variability in the location of the ice edges, the images show smearing at the ice margins. In the Northern Hemisphere, the sea ice cover in the Arctic Basin is confined by surrounding land areas, but the sea ice reaches the peripheral seas and can go as far south as 44° N. In the Southern Hemisphere, the sea ice cover surrounds the Antarctic continent and is generally symmetric in winter and on the average covers the Southern Ocean up to latitudes near 55° S. The sea ice in the Arctic is exposed to colder temperatures and is generally thicker than in the Antarctic. However, the ice in the Antarctic is more expansive, partly because no land boundary at the ice edges limits its growth. The trends in ice cover in the two hemispheres are different: it is declining significantly in the Northern Hemisphere while it is expanding, albeit modestly, in the Southern Hemisphere. To some extent, this phenomenon is caused by differences in the geographical environment of the ice cover and the climate system of the two regions. It is, however, interesting to note that when the monthly values from the two hemispheres are added together for each month the sea ice cover shows a relatively uniform distribution with a slightly negative trend of about 2 % per decade.
Fig. 1.1: Color-coded ice concentration maps during maximum and minimum extents for 2014 in the (a, b) Northern Hemis...