Radical economist Jack Rasmus shows how the Obama administration failed to deliver on its promises of economic recovery and social justice and puts forward alternative proposals for how the administration could have realised these goals. In the period of Obama's presidency, corporate profits were up, and economic hardship was the bitter reality for millions of US citizens. Rasmus argues that the weakest economic recovery since 1947 was the direct result of the Obama administration's failure to take decisive action. Analysing deficit cutting, the fear of a global depression, tactical populism and austerity, this book is a clear and cutting antidote to current liberal narratives. From Obama's presidential election to the passage of his 2012 budget, this book explains how the US economy failed and why the risk of a 'double dip' recession was on the cards.
- 216 pages
- English
- ePUB (mobile friendly)
- Available on iOS & Android
eBook - ePub
About this book
Trusted by 375,005 students
Access to over 1.5 million titles for a fair monthly price.
Study more efficiently using our study tools.
Information
1
The Weakest, Most Lopsided Recovery

‘Who Recovered, Who Didn’t, and Why’
With less than a year remaining before the November 2012 elections, the policies that have come to define Obama’s economy have been largely implemented. The results and consequences are mostly known or predictable. Significant further economic stimulus in 2012 beyond that introduced in late 2011 is highly improbable or likely to prove token and ineffective. It is appropriate at this juncture therefore to assess the performance of Obama’s economy over the past three years; to understand why its policies and programs have failed to generate a sustained economic recovery; and to explain why the uneven recovery has benefited only the wealthy and powerful few at the direct expense of the rest.
Economic recovery under Obama’s economy has been the weakest recovery on record of all the eleven recessions in the U.S. since 1945. It has also proven the most lopsided recovery of all the postwar recessions—benefiting investors, corporations, and the wealthiest 10% of households, but not workers, homeowners, small businesses, or the remaining ‘bottom’ 80% of households in the U.S.—more than 100 million. Furthermore, as of late 2011 the economy now appears on its way to a second contraction, or ‘double dip’, if not in 2012 for certain sometime in 2013.
Important sections of the economy—jobs and housing—had already experienced a ‘relapse’ in 2010 and by 2011 appeared headed for yet a second ‘relapse’.1 After a collapse of employment of historic dimensions from mid 2008 through June 2009, the U.S. jobs market underwent a relapse in the summer of 2010. For a second time, employment levels fell. The jobless numbers continued to rise for four consecutive months, from June to September 2010. That was followed by a modest growth of employment for a short period, from the early fall of 2010 into the spring of 2011, after which job growth slowed sharply once again. A similar scenario describes the housing market. Residential housing—which experienced a deep collapse from 2007 through 2009 not seen since the Great Depression of the 1930s—recovered briefly in late 2009. It subsequently declined again in the summer of 2010, recover briefly once more, and retreated yet again.
Other key sectors of the economy also showed significant weakness twelve months after the official end of the recession in June 2009. Twelve months after the June 2009 low, many had regained at best only half their losses from the deep contraction of 2008–09.
Retail sales recovered only half of their 2008–09 losses by summer 2010. Business spending rose only 3% in the first half of 2010, after having fallen to a postwar record of –6.7% in 2009. Industrial production was still off 30% by mid 2010, as were durable goods orders. After rising to 58 in the first quarter of 2010, the index for manufacturing activity had fallen once again to 50 by July 2010, indicating ‘no growth’.
Following the June 2009 recession low point, the broader U.S. economy entered its first relapse in the summer of 2010. That first relapse was followed by an even briefer recovery of six months. But the economy soon began to weaken again in 2011. Gross domestic product (GDP), the measure of total economic output, fell from 2.3% in the closing quarter of 2010 to roughly one-third (0.8%) that level in the first six months of 2011. Both jobs and housing markets slowed even more, both headed for yet a ‘third’ dip. By late 2011, it became increasingly clear that the U.S. economy was not even close to achieving self-sustaining recovery, and was possibly headed toward a double-dip recession.2
The unprecedented weakness of the U.S. economy today—four years after the recession began in December 2007 and more than two years after the recession was officially declared over in June 2009—is illustrated by a comparison of the current faltering, ‘stop–go’ recovery with the two previously most severe recessions of 1973–75 and 1981–82.
THE WEAKEST RECOVERY SINCE 1945
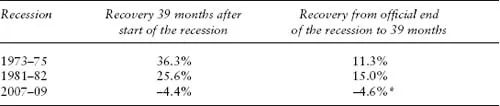
Comparing the Obama ‘recovery’ to the two other worst recessions since 1945—those of 1973–75 and 1981–82—the track record to date since 2009 offers a dramatic contrast.
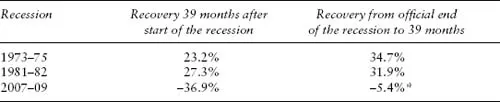
Thirty-nine months after the 1973–75 recession, GDP had risen 4.8% over pre-recession levels. Thirty-nine months after the 1981–82 recession, GDP rose by 9.8% over pre-recession levels. In stark contrast, GDP 39 months after the start of the 2007–09 recession was still below pre-recession levels. This comparison of recoveries is summarized in Table 1.1.
Table 1.1 Post-recession recoveries compared, GDP index
(Seasonally adjusted; index 100 = 2005)
 | |
| Recession | Recovery 39 months after start of the recession |
| | |
| 1973–75 | 4.8% |
| 1981–82 | 9.8% |
| 2007–09 | –0.1% |
| | |
Source: U.S. Commerce Department, National Income and Product Accounts, Table 1.1.3, June 24, 2011, and National Income and Product Accounts, Table 1.1.3, December 22, 2011.
The Jobs Picture
Comparing the recovery of jobs in the three recessions is even more dramatic than comparing GDP figures. Following both prior recessions in the 1970s and 1980s, total employment had risen by 5–6% over pre-recession levels after 39 months. In today’s recession, jobs are still 5% below 2007 pre-recession levels by the most conservative estimates. And if workers who have left the labor force are counted, it’s 8–10% below. As of the fourth quarter of 2011, there are a minimum of 25 million still without work nearly four years after the current recession officially began in December 2007.
To get back to the 7.1 million unemployment level of December 2007 before the recession began would take more than ten years of creating 300,000 jobs a month, every month, for more than a decade. Thus far, for the first nine months of 2011, the average net new job creation has been well less than 100,000 a month.
Since 2000 the rate of new job creation in the U.S. has been historically weak even in good times. For nearly three years following the prior mild recession of 2001, jobs for non-supervisory wage and salary workers hardly grew at all until 2004. Thereafter jobs grew mostly as a result of the unhealthy over-expansion of the financial and construction sectors of the economy during the decade. And when the financial crisis and recession hit in late 2007, jobs collapsed even faster in those two sectors than in the rest of the economy.
For example, the number of wage and salary workers employed at the end of 2001 was 100,343,000. By the bottom of the recession in June 2009 that number had fallen to 100,033,000. All the jobs created in the intervening years, 2002–08, had been wiped out. By June 2011—two years after the end of the current recession in June 2009—total employment was still only 100,397,000. That’s a net long-term gain of jobs of only 54,000 after ten years. In short, the economy had not only regressed to job levels where it was in 2009, but retreated all the way back to where it was a decade ago!3 The comparison of the Obama recovery period with prior recessions is depicted in Figure 1.1.
There are three great ‘mini-crises’ within the general crisis of the U.S. economy today, which explain, in significant part, why the general economy has been unable to generate a sustained recovery. The three mini-crises are: jobs, housing foreclosures, and the fiscal crisis of state and local governments. Tables 1.2 and 1.3 show a comparison of the Obama recovery with the two prior worst recessions, 1973–75 and 1981–82, in terms of housing and local governments.
The Housing Picture
There has never been a sustained recovery from a recession since 1945 without a recovery in housing and construction. A comparison of the Obama recovery with prior recoveries shows that construction recovered sharply from recession lows in both 1973–75 and 1981–82 after 39 months. After 39 months, construction was up by more than 30% from the start of the recession in both prior recession recoveries in the 1970s and 1980s. In contrast, construction fell by more than 30% during the recent 2007–09 recession and subsequently has fallen by another 11%. Construction is not only not recovering, it is already in what is called a ‘double dip’, i.e. second recession.
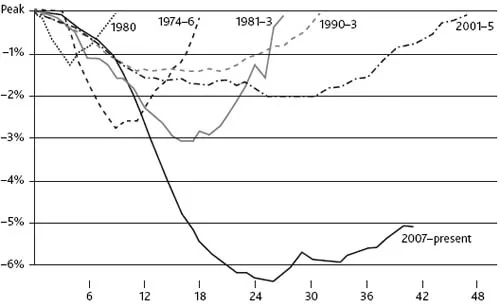
Months after peak
Figure 1.1 Comparing recessions and recoveries: job changes
Notes: Horizontal axis shows months. Vertical axis shows the ratio of that month’s nonfarm payrolls to the nonfarm payrolls at the start of recession. Because employment is a lagging indicator, the dates for these employment trends are not exactly synchronized with the NBER’s official business cycle dates.
Source: Federal Reserve Bank of Minneapolis, www.Minneapolisfed.org.
Table 1.2 Construction sector recoveries compared, residential plus non-residential structures
($ billions, seasonally adjusted; index 100 = 2005)
* 27 months from the end of the recession.
Source: U.S. Commerce Department, National Income and Product Accounts, Table 1.1.3, June 24, 2011, and National Income and Product Accounts, Table 1.1.3, December 22, 2011.
More dramatic still is the condition of residential housing. According to the leading industry research source, RealtyTrac, more than 11.4 million homes have already foreclosed.4 The number is undoubtedly larger, since many have lost their homes through ‘short sales’ and by just ‘walking away’ from their mortgages without having gone through the legal process of foreclosure.5 Other sources predict 13–14 million, or about one in four homeowners, will have eventually faced foreclosure before the housing sector bottoms out. As home prices began falling a second time (i.e. double dip) in 2011, the number of homes in ‘negative equity’ (i.e. home values worth less than the mortgage) rose to approximately 16–17 million. Foreclosures and negative equity comprise nearly half of all the 54 million mortgages in the U.S. After nearly four years of Obama recovery, the housing sector remains mired in what can only be described as a deep ‘depression’. New home construction is off 75% from prior peak levels, home price declines average almost 40% and, except for minimal apartment construction, there are no signs whatsoever of recovery on the horizon.
Figure 1.2 shows clearly that foreclosure activity not only peaked under Obama in 2009–10 but remained consistently high until the ‘robo-signing foreclosure’ scandal that erupted in summer 2010, in which banks foreclosed and repossessed many homes illegally. That scandal precipitated a public reaction on the eve of the November 2010 midterm Congressional elections. The banks then temporarily backed off processing foreclosures and home repossessions at their prior record rate during the summer of 2010. By mid 2011, foreclosure and bank repossession rates rose sharply once again.
As James Saccacio, CEO of RealtyTrac, commented on the temporary slowdown in foreclosures in late 2010 due to the robo-signing scandal, “Total properties foreclosure filings would have easily exceeded 3 million in 2010 had it not been for the fourth quarter drop in foreclosure activity—triggered mainly by the continuing controversy surrounding foreclosure documentation and procedures that prompted many major lenders to temporarily halt some foreclosure proceedings.” And as RealtyTrac senior vice-president Rick Sharga added, concerning the summer 2011 resumption of foreclosures: “We’re on track for a record year for homes in foreclosure and repossessions...There is no improvement in the underlying economic conditions.”6 By late summer 2011, foreclosures were once again rising at a 2.5 million annual rate.
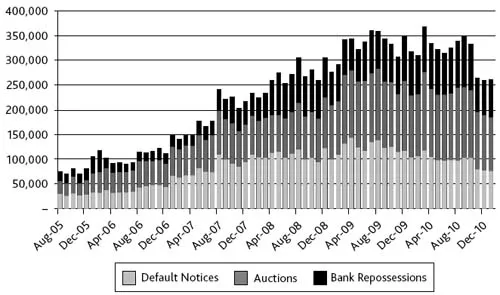
Figure 1.2 Home foreclosure activity in the U.S., 2005–11
Source: RealtyTrac.
State and Local Government Picture
In the two prior worst recessions of 1973–75 and 1981–82, state and local government spending grew through the recessions and continued thereafter into the recovery period. State and local government spending thus offset the sharp declines in private sector spending and job loss. This moderated the depth and cut short the duration of those prior recessions, and allowed recovery to occur more rapidly. This has not happened in the current Obama recession. For the first time, the state and local government sector has not taken up the slack in the private sector during the downturn. State and local government has thus played no role in offsetting the decline in the private sector of the economy, during the recession or after. In fact, state and local governments are now a major contributing factor to job loss and a major drag on recovery. This job trend and drag on the economy will continue in 2012 and beyond, it appears.
Table 1.3 State and local government recoveries compared
($ billions, seasonally adjusted; index 100 = 2005)
* 27 months ...
Table of contents
- Cover
- Title page
- Copyright page
- Contents
- INTRODUCTION: A SYSTEMIC CRISIS OF RECOVERY
- 1 THE WEAKEST, MOST LOPSIDED RECOVERY
- 2 FROM TAX CUTS TO TACTICAL POPULISM
- 3 OBAMA’S JOBLESS-HOMELESS STIMULUS
- 4 A RECORD SHORT, FALTERING RECOVERY
- 5 HOW MORE IS LESS OF THE SAME
- 6 HISTORICAL PARALLELS AND THE 2010 MIDTERM ELECTIONS
- 7 DEFICIT CUTTING ON THE ROAD TO DOUBLE DIP
- 8 SLIDING TOWARD GLOBAL DEPRESSION?
- 9 FROM FAILED RECOVERY TO AUSTERITY RECESSION
- 10 AN ALTERNATIVE PROGRAM FOR ECONOMIC RECOVERY
- Notes
- Index
Frequently asked questions
Yes, you can cancel anytime from the Subscription tab in your account settings on the Perlego website. Your subscription will stay active until the end of your current billing period. Learn how to cancel your subscription
No, books cannot be downloaded as external files, such as PDFs, for use outside of Perlego. However, you can download books within the Perlego app for offline reading on mobile or tablet. Learn how to download books offline
Perlego offers two plans: Essential and Complete
- Essential is ideal for learners and professionals who enjoy exploring a wide range of subjects. Access the Essential Library with 800,000+ trusted titles and best-sellers across business, personal growth, and the humanities. Includes unlimited reading time and Standard Read Aloud voice.
- Complete: Perfect for advanced learners and researchers needing full, unrestricted access. Unlock 1.5M+ books across hundreds of subjects, including academic and specialized titles. The Complete Plan also includes advanced features like Premium Read Aloud and Research Assistant.
We are an online textbook subscription service, where you can get access to an entire online library for less than the price of a single book per month. With over 1.5 million books across 990+ topics, we’ve got you covered! Learn about our mission
Look out for the read-aloud symbol on your next book to see if you can listen to it. The read-aloud tool reads text aloud for you, highlighting the text as it is being read. You can pause it, speed it up and slow it down. Learn more about Read Aloud
Yes! You can use the Perlego app on both iOS and Android devices to read anytime, anywhere — even offline. Perfect for commutes or when you’re on the go.
Please note we cannot support devices running on iOS 13 and Android 7 or earlier. Learn more about using the app
Please note we cannot support devices running on iOS 13 and Android 7 or earlier. Learn more about using the app
Yes, you can access Obama's Economy by Jack Rasmus in PDF and/or ePUB format, as well as other popular books in Economics & Economic Policy. We have over 1.5 million books available in our catalogue for you to explore.