
Mastering Microsoft Power BI
Brett Powell
- 638 pages
- English
- ePUB (mobile friendly)
- Available on iOS & Android
Mastering Microsoft Power BI
Brett Powell
About This Book
Design, create and manage robust Power BI solutions to gain meaningful business insights
Key Features
- Master all the dashboarding and reporting features of Microsoft Power BI
- Combine data from multiple sources, create stunning visualizations and publish your reports across multiple platforms
- A comprehensive guide with real-world use cases and examples demonstrating how you can get the best out of Microsoft Power BI
Book Description
This book is intended for business intelligence professionals responsible for the design and development of Power BI content as well as managers, architects and administrators who oversee Power BI projects and deployments. The chapters flow from the planning of a Power BI project through the development and distribution of content to the administration of Power BI for an organization.BI developers will learn how to create sustainable and impactful Power BI datasets, reports, and dashboards. This includes connecting to data sources, shaping and enhancing source data, and developing an analytical data model. Additionally, top report and dashboard design practices are described using features such as Bookmarks and the Power KPI visual.BI managers will learn how Power BI's tools work together such as with the On-premises data gateway and how content can be staged and securely distributed via Apps. Additionally, both the Power BI Report Server and Power BI Premium are reviewed.By the end of this book, you will be confident in creating effective charts, tables, reports or dashboards for any kind of data using the tools and techniques in Microsoft Power BI.
What you will learn
- Build efficient data retrieval and transformation processes with the Power Query M Language
- Design scalable, user-friendly DirectQuery and Import Data Models
- Develop visually rich, immersive, and interactive reports and dashboards
- Maintain version control and stage deployments across development, test, and production environments
- Manage and monitor the Power BI Service and the On-premises data gateway
- Develop a fully on-premise solution with the Power BI Report Server
- Scale up a Power BI solution via Power BI Premium capacity and migration to Azure Analysis Services or SQL Server Analysis Services
Who this book is for
Business Intelligence professionals and existing Power BI users looking to master Power BI for all their data visualization and dashboarding needs will find this book to be useful. While understanding of the basic BI concepts is required, some exposure to Microsoft Power BI will be helpful.
]]>
Frequently asked questions
Information
Creating and Formatting Power BI Reports
- Report planning
- Live connections to Power BI datasets
- Visualization best practices
- Choosing the visual
- Visual interactions
- Slicers
- What-if parameters
- Report filter scopes
- Relative date filtering
- Conditional formatting
- Mobile-optimized reports
Report planning
- Identify the users or consumers of this report:
- Senior managers generally prefer less self-service interactivity and value simple, intuitive visuals, such as KPIs.
- Analysts often require significant flexibility to filter and interact with more detailed reports. For example, reports used by analysts generally include more slicer visuals and may include table or matrix visuals as well.
- Define the business question(s) that the report should answer or support:
- Confirm with the business user(s) or project sponsors that this is the appropriate focus and scope of the report:
- A report architecture diagram described in the next section can support this communication.
- For example, the user could be advised that a particular business question or metric will be included in a different report but will be featured on the same dashboard and will be easily accessible within the same Power BI app.
- The most important business question (for example, What were our sales?) will be addressed in the top-left corner of the report canvas, likely with a KPI or card visual.
- Confirm with the business user(s) or project sponsors that this is the appropriate focus and scope of the report:
- Confirm that the dataset supports the business questions:
- The report author should ensure that the dataset includes measures such as year-over-year (YOY) sales and the dimension columns (for example, Product Category) necessary to visualize the business questions.
-
- If a gap exists between the dataset and the measures required for the report, the team can determine whether the dataset should be extended or whether the measure should be created local to the report
- Only measures can be created within Power BI Live connection reports
- Any new columns, tables, or modifications to existing tables or columns must be implemented within the source dataset
- Determine how the report will be accessed and the nature of any user interactivity:
- Reports and dashboards can be optimized for mobile device consumption if this use case is expected
- Power BI Desktop supports slicer visuals, a What-if parameter, and visual interaction options as standard features:
- Reports can, therefore, be designed for static consumption or to support rich data exploration
- Draw a sketch of the report layout:
- At least for the primary page of the report, document how the area of the report canvas will be allocated
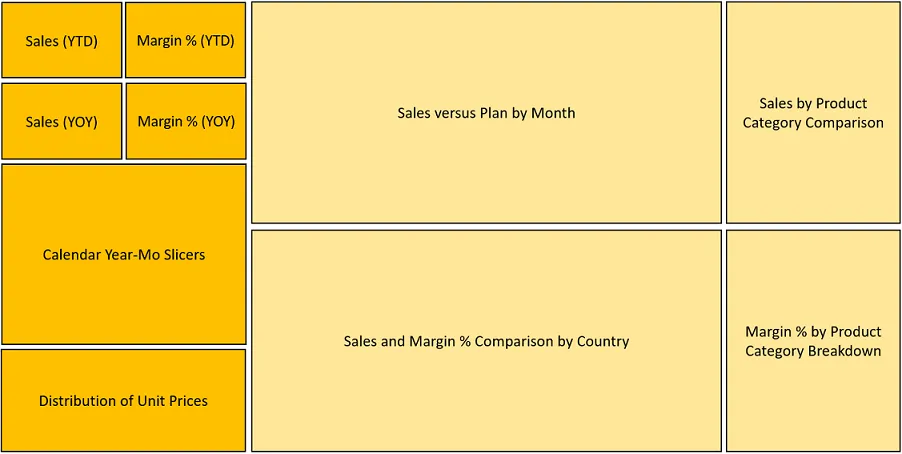
-
- Per the sample layout, the critical sales and margin measures are located in the top-left corner of the report page:
-
- Slicer (filter) visuals are planned for below these KPI or card visuals and other visuals will add further context
- Greater space is allocated to the two visuals in the middle of the page given their importance to the report
- The report layout sketch can be used exclusively for planning purposes or can be set as the background for a report page
- For example, a PowerPoint slide of the same shapes, background shading, and borders can be saved to a network directory as a PNG file
- In Power BI Desktop, the PNG file can be imported via the Add Image formatting option under Page Background or via the insert an image icon on the Home tab in Report view
- Page background images with proper alignment, spacing, and colors can expedite quality report development