1 The global view
What you will understand after reading this chapter
The world economy is an exciting topic. The two oil crises of the 1970s, the Great Depression in the 1930s, the failure of Latin America in the lost decade of the 1980s, the collapse of the centrally planned economies at the end of the 1980s, the success of the Asian ‘tigers’ in spite of their temporary financial crises in 1997/1998 and the rise of China – these are all fascinating issues (section 1.1). The world economy is becoming more global. The segmentation of markets is being reduced. Many catalysts are at work for globalization (section 1.2). Then, the reader will be introduced to the most important variables of the world economy, notably world gross product and its composition from the production and the expenditure side as well as its regional structure (section 1.3). The world economy is in a process of continuous change. Thus, the newly industrializing countries have succeeded in becoming more integrated into the international division of labor (section 1.4). Some of them have reached remarkable places in the ranking of competitiveness (section 1.5). Rising out of poverty is the solution for the low-income countries; it is an answer to the equity issue (section 1.6). For these issues and other problems we take a global view, looking at the world as being analyzed from outer space (section 1.7).
1.1 Seven pictures of the world economy
Picture 1
Let us turn back the clock some 150 years. At that time, Japan was a closed economy without significant international relations in either the economic or the cultural field. During the Meiji Revolution in 1868, Japan opened itself consciously to the outside world. For the early periods of the opening process and of its development, it is reported that Japan started to produce spokes for imported bicycles and in this way pursued a policy of import substitution. At the end of the 1920s, Japan had become an important exporting country with a share of the world export volume of approximately 3 percent. After Japan’s economic collapse owing to World War II, Japan had to start building up its economy from scratch. In 1950, Japan had a relatively insignificant position in the world economy; its share of the world export volume amounted to 1 percent. In 1986 and 1993, it surpassed 10 percent. In 2004, Japan provided about 6 percent of the world export volume, and its efficient industry poses, in spite of some problems in the 1990s, a real challenge to North America as well as Europe.
In the last twenty-five years, China has integrated itself into the international division of labor. Starting from a world market share of only 1 percent in 1980, it now accounts for 6 percent of world trade (2004). China will rise to one of the world’s major economic players within the next ten years.
How does a country manage to integrate itself successfully into the international division of labor? How does an open country efficiently use its resources so that it reaches a maximum of welfare gains from trade? Which mechanisms cause an economy to produce those export goods that are demanded in the world? What does a policy concept with a consistent international orientation look like? Where are the limits of the process of economic growth through trade? Does continuing success with export goods mean that worldwide demand for the currency of the country is growing considerably, eventually culminating in an appreciation so that price competitiveness is partly diminished? How did Japan’s structural problems in the 1990s affect its growth potential? What experience on catching up do we have for other countries? How will the economic core of the world economy shift in the next thirty or fifty years?
Picture 2
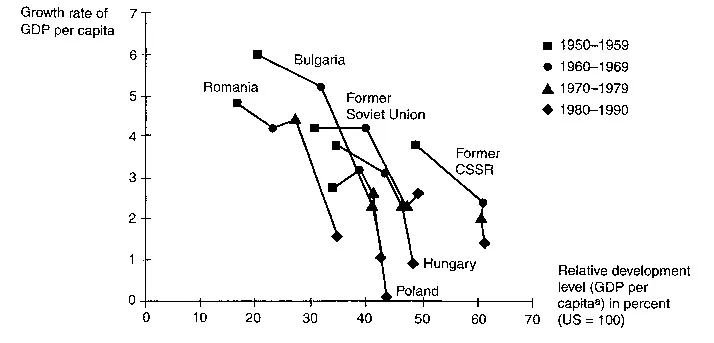
After 1945, the centrally planned economies of Eastern Europe were unable to reduce their development gap to the US. Whereas during the 1950s and the 1960s relatively high real GDP growth rates per capita of the communist countries could still be recorded, the 1970s are characterized by very low growth rates. During the 1980s, the communist systems collapsed. The communist countries failed to adequately provide their citizens with goods. In Figure 1.1, the relative distance to the US level of GDP per capita is denoted on the horizontal axis, growth rates are depicted on the vertical axis. High growth rates in a decade would move a country to an improved relative position to the US. Note that purchasing power parities are used; nevertheless comparisons may be distorted.
What are the reasons for this failure of the communist system? Apart from an inefficient planning system, lacking property rights and setting wrong incentives, how important was the so-called ‘division of labor planned from above’ for the miscarriage? How relevant was the attempt of the centrally planned socialist economies in the COMECON (Council of Mutual Economic Assistance) in Eastern Europe to exploit economies of scale in production by an explicit process of specialization? Buses for the COMECON countries were produced in Hungary, tram cars in former Czechoslovakia, and railway cars in former East Germany. This specialization, planned from above, eliminated competition between the COMECON economies, which were exempted from international competition anyway.
How can we explain why economies do not catch up? Why are some countries unable to sustain their prosperity level? Why do they even suffer a selfinflicted erosion of their economic competitiveness relative to other countries? Why did Sweden fall back from its third ranking in GDP per capital (in purchasing power parity) per capita in 1970 among the OECD countries to fourteenth ranking in 1991 (Lindbeck et al. 1994: Table 1.1)?
Are the three large continental countries in Europe – Germany, France, and Italy – experiencing a similar process of erosion in the 1990s and the first decade of the twenty-first century? How long can governments conceal such processes from their population? When do people, drawing comparisons with other countries, become aware of their deteriorated economic situation? Under what conditions will countries fall behind?
Picture 3
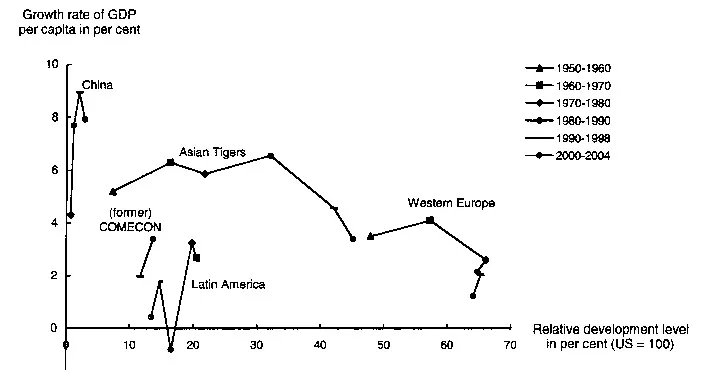
The different regions of the world experienced quite different growth performances. Instead of purchasing power parity as in Figure 1.1, we now use constant 2000 market prices. Annual GDPs at market prices are expressed in constant US dollar at the annual exchange rates. Since ten-year averages of constant 2000 prices are used, exchange rate fluctuations within a decade should be mitigated (Figure 1.2). Latin America recorded positive GDP growth rates per capita in the 1950s (not shown), 1960s, and 1970s. However, it had a negative per capita average growth rate in the 1980s, its ‘lost decade.’ It also was affected by currency crises. It pursued an economic policy that failed. By means of an import substitution policy, it partly excluded itself from the international division of labor. Imports were hindered, and domestic sectors were not exposed to international competition. Until the 1980s, for example, Mexico practiced a system of import licenses where, as a rule, an import license was linked to a stronger peso in a system of split exchange rates. In this way, license holders could buy imported goods at a preferential price. This system was governed by a bureaucracy, which made it possible for the politicians in charge to exert political power. Mexico did not give up this policy until the 1980s and joined the GATT only in 1986. The positive per capita growth rates of Latin American countries in the 1950s, 1960s, 1970s, and 1990s between 1 and 3 percent were not sufficient to reduce the income gap relative to the US, where the growth rate was higher.
Figure 1.1 Economic growth in the centrally planned economies of Central and Eastern Europe, 1950–1990 (source: Heitger 1993, according to data from Summers and Heston 1988, 1991).
Note
a Calculated with purchasing power parity.
The development of the Asian countries on the Pacific rim took a different course. Starting in the 1950s most Asian economies pursued a policy of international orientation exposing their economies to competition from abroad. On average, discrimination in favor of the domestic relative to the external sector was not prevalent. Until the Asian financial crisis of 1997/1998, the four ‘tigers’ (Hong Kong, South Korea, Taiwan, Singapore) had real growth rates of 6 percent (and higher) for nearly five decades. Following the currency crisis in 1997–1998, the growth rate in 1999–2003 was lower and volatile, with an average of 4.5 percent. China has had an average GDP growth rates of over 9 percent in the period 1984–2004, reaching 3 percent of US income per capita in market prices in 2004. In purchasing power parity, it is at 14 percent of the US level.
In the COMECON countries, the decline in growth rates in purchasing power parity of Figure 1.1 is confirmed when constant market prices are used in Figure 1.2. Note that in market prices the relative distance of these countries to the US is much larger than in purchasing power parities. During their transformation, the post-communist countries experienced high negative growth rates (‘valley of tears’), but they now have surpassed the output level they have had at the start of the transformation shock. The data for 2000–2004 indicate that the lowest point has been surpassed. High growth rates for the first four years of the twenty-first century herald a real catch up process relative to the position of the US.
Western Europe has caught up with the United States over three decades since 1950. Starting in the 1980s the European position has been stagnant as compared the US. Since 2000 a strong US economy with high productivity growth has resulted in a marginal decline of Western Europe’s relative position.
Sub-Saharan Africa shows no growth. In the period 1990–2003, the GDP per capita growth rate was at minus 0.3 percent. This is partly due to the fact that during the 1990s, population growth of 2.6 percent in this region of the world exceeded the GDP growth rate of 2.3 percent. Many countries in Africa were, and still are, caught in internal wars caused by power-hungry politicians and tribal conflicts. Severe uncertainty in the institutional set-up prevails in many economies. Corruption represents a serious distortion.
Figure 1.2 Economic growtha in the major regionsb of the world, 1950–2004 (source: World Bank, World Development Indicators March 2005).
Notes
a Real GDP per capita growth rates in market prices (constant 2000 US dollars). Annual averages of market exchange rates.
b Four ‘tigers’: Hong Kong, South Korea, Taiwan (excluded from 1970), Singapore.
What are the necessary ingredients for a successful growth process? Why do countries stagnate relative to others, why do some fall back? Did those countries pursuing a policy of import substitution and protection from foreign trade deprive themselves of possible development prospects and potential welfare gains? What is the relationship between international orientation and economic growth? Do open economies experience stronger growth?
Picture 4
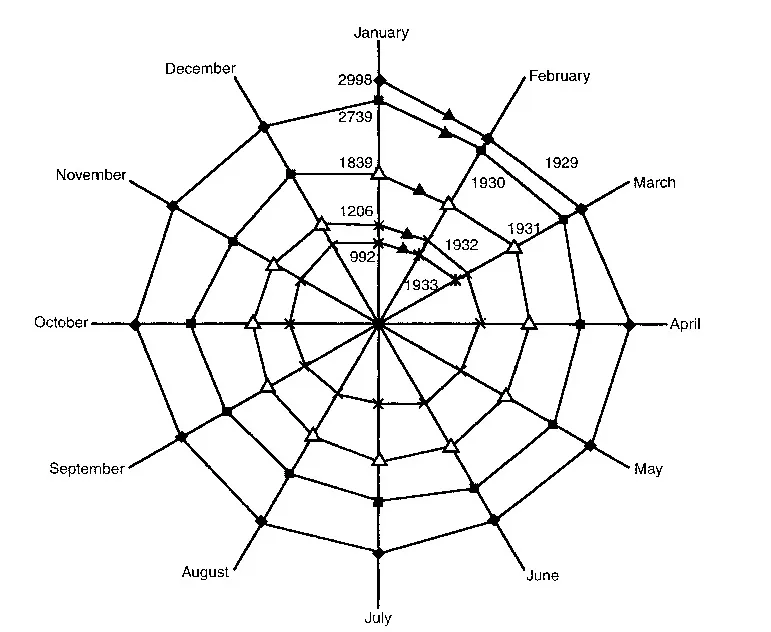
At the time of the Great Depression in 1929–1933, the world economy experienced a massive breakdown. The volume of world trade fell to one-third of its initial level within four years. The so-called Kindleberger spiral shows how the world import volume of seventy-five countries, which can be regarded as a world trade indicator, dwindled from month to month (Figure 1.3).
What would be the effects of such a breakdown of world trade today? For instance, the US is exporting 10 percent of its GDP (2003); a fall of its exports to one-third would mean a reduction of 3 percent of aggregate demand – a severe recession. Or take Germany, which exports 38 percent of its GDP (2004). Here, a drop in the export volume to one-third would represent an 11 percent drop in aggregate demand and a devastating depression. Related questions are: will a financial crisis affect the real sphere of the economy? And if so, how? What are the costs if a financial bubble bursts and what if a currency crisis hits an economy? Under what conditions can a regional currency crisis like the Asian crisis in 1997/1998, the Brazilian crisis in 1999, and the Turkish crisis in 2001 be contained? Under what conditions is contagion inevitable?
Figure 1.3 The Kindleberger spirala (source: Kindleberger 1973: 172).
Note
a World import volume in million US$ gold.
Picture 5
During the two oil price shocks in the 1970s the oil price increased nearly twentyfold compared to the 1960s (Figure 1.4). Whereas in the 1960s the oil price was significantly below US$2 per barrel of crude oil, it increased fivefold to approximately US$10 during the first oil crisis in 1973/1974. During the second oil price shock in 1979/1980, the price per barrel rose from US$2 to nearly US$40. The reason for this development was that the resource countries claimed the property rights to the crude oil reserves in their soil, even those not yet explored. In this way the seven big international oil companies (‘seven sisters’) were cut off from their supply sources. Under the terms of the concession contracts that were used until then, the oil firms had to pay a given percentage of their proceeds from the extracted amount of oil (royalty). De facto, they were in charge of the oil extraction and also held the right (often for a period of up to seventy years) to explore and tap new oil wells. At the beginning of the 1970s, the oil exploitation rights were transferred to the resource countries. As a consequence, the world’s oil supply could no longer be allocated in the vertical hierarchy of the enterprises (extraction, refinery, transport, distribution). Instead, markets – especially the Rotterdam spot market, but later on also forward markets – increasingly took over the allocation of oil.
The impact of the oil crisis was that the capital stock, geared to the low oil prices of the 1960s, became partly obsolete, especially fuel-intensive machines in the production process and the engines of transport vehicles. The productivity of existing capital fell, reducing production, employment, and growth. At the same time, a redistribution of real income in favor of the oil-producing countries took place. The countries without oil resources, particularly the industrialized nations, had to give away more export goods per barrel of imported oil than before, their terms of trade deteriorated. In the end, the oil-producing countries had considerable petro-dollar earnings at their disposal which could not be completely absorbed by their imports. A petro-dollar recycling took place, which later became the germ cell of the debt crisis of the developing countries. Meanwhile, the oil price had reached about US$65 in the autumn of 2005, and US$100 per barrel are forec...