- 240 pages
- English
- ePUB (mobile friendly)
- Available on iOS & Android
eBook - ePub
Debt, Risk and Liquidity in Futures Markets
About this book
The issues of developing country debt crises, increased volatility and risk, and the determination of market liquidity are high on the agendas of policy makers, market participants and researchers in the area of financial markets. These issues are also of major importance to regulators and exchange officials. This book contains a collection of eigh
Trusted by 375,005 students
Access to over 1.5 million titles for a fair monthly price.
Study more efficiently using our study tools.
Information
1 Editor’s introduction
Optimal debt and aspects of risk and liquidity
Barry A. Goss
This book is divided into three sections: first, developing country debt; second, volatility and risk; and third, liquidity. Each of these areas has important unresolved issues regarding financial markets in general, and futures markets in particular. Moreover, in each case the futures markets aspects of these issues appear to have received relatively less attention than their spot market counterparts. Indeed, there are reasons to expect futures markets to behave differently compared with spot markets, because of important asymmetries between spot and futures markets, and within futures markets. An example of the first type of asymmetry is that futures markets operate on margin, whereas spot market transactions typically require payment in full. An example of the second type of asymmetry is that within futures markets, delivery, if possible, is only at seller’s option.
The papers included in this volume have been selected because each provides new insights into an open question in the area of, or pertinent to, futures markets. These papers discuss the following issues:
- debt in excess of the optimal as a warning signal of impending financial crises1
- trading characteristics of Chinese futures markets
- recent contributions to the literature on performance of agricultural futures markets
- Fourier analysis of intraday data, which avoids homogenization
- realized volatility in a thin currency futures market
- forecasting and profits in currency futures
- traders’ perceptions of the price path in the presence of order imbalance
- simultaneous relationships between liquidity, volume and volatility in US electricity futures markets.
Optimal debt in East Asia 1994–96
Conventional indicators of macroeconomic performance, such as inflation rate, ratio of budget deficit to GDP and ratio of current account deficit to GDP, failed to anticipate the Asian crises of 1997–98. The same is true also of the reports of sovereign credit rating agencies. Yet some researchers have wondered whether there was information in the market, if one only knew how to identify and extract it, which could be used to predict the onset of such an event. In Chapter 2 Stein and Lim provide an answer to this question. The information is that the exchange rates of some Asian countries were misaligned, and for some Asian countries the ratio of debt to net worth, relative to net risk-adjusted returns, was excessive. These two pieces of information suggested that a currency and/or debt crisis were likely if a random shock were to occur.
The analysis in Chapter 2 is based on Stein’s (1995) theory of the Natural Real Exchange Rate (NATREX) and the stochastic optimal control theory of foreign debt of Fleming and Stein (2001), which was used by Stein and Paladino (2001) to analyse foreign debt of inter alia African, South American, Asian and Eastern European countries. These two theories recently have been brought together in Stein (2006). Stein’s (1995) NATREX is an equilibrium medium and long term real exchange rate, which assumes internal balance (e.g. capacity utilization is at its long run mean) and external balance (e.g. equality between domestic and foreign real interest rates, and no speculative capital flows).
The NATREX is expressed as R[Z(t)], where R is the real exchange rate, and is quoted as units of foreign currency per unit of domestic currency (raise is an appreciation of domestic currency), Z represents fundamentals and other exogenous variables and t is time. The actual real exchange rate at time t is R(t), and the difference between the actual and equilibrium rates is

where Φt is a measure of misalignment of the actual rate relative to NATREX. If Φt>0 this indicates overvaluation of the domestic currency, and suggests that depreciation or possibly a currency crisis2 is probable. Conversely, if Φt<0 this indicates undervaluation of the domestic currency, and suggests that inflationary pressure will likely follow in the presence of a pegged nominal rate. Stein (2006, p. 11) suggests that a difference between the actual real rate and NATREX may be due to interest differentials, cyclical factors and/or speculative capital flows.
The optimal debt ratio f *, of Stein and Lim in Chapter 2, is that which maximizes a HARA (hyperbolic absolute risk aversion) expected utility function of discounted consumption, subject to the constraints that consumption and net worth (X) are always positive. In this model, which is based on Fleming and Stein (2001) and summarized in Stein (2006, pp. 20–24, 28–37), the current external debt (Lt) is expressed as a ratio (ft) of net worth, which is defined as capital (K) minus debt.3 Thus
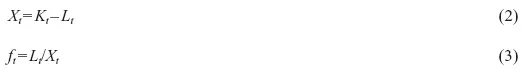
A measure of excess debt is the difference between the current debt ratio and that which is optimal

The optimal debt ratio can be expected to vary inter alia with the mean net rate of return adjusted for risk (b – r)/σ, where b=Y/K is the productivity of capital (Y =GDP), r is the real rate of interest and σ2=var (b – r). In this model there are two stochastic variables, Y and r, which are both assumed to follow Brownian motion with drift.
The implications of this analysis are threefold. First, if the domestic currency is overvalued relative to NATREX (Φt>0), this acts as a warning signal that a devaluation, or possibly a currency crisis, is likely. Second, if the current debt ratio exceeds the optimal (Ψ>0), this acts as a warning signal that a debt crisis is likely if a random shock occurs. Third, there may be interaction between a misaligned exchange rate and excess debt, which can increase the probability of a currency and/or debt crisis. For example, if mean net returns fall due to a decline in domestic productivity, capital outflow may occur, which can lead to devaluation. This devaluation will likely make it more difficult for the domestic economy to service external debt, which, if denominated in US dollars, implies a shock to the real rate of interest, and can lead to default.4
In Chapter 2 Stein and Lim estimate the NATREX for five Asian economies (Indonesia, Korea, Malaysia, the Philippines and Thailand) for the period 1982–2000. They find that
- Thailand had prolonged exchange rate misalignment 1990–96
- there was minor misalignment for Korea 1995–97
- there was no misalignment for Indonesia, Malaysia or the Philippines.
The authors then estimate the time paths of the ratio of external debt to GDP and net return on investment (b – r) for these five economies. They argue that if returns are falling but the debt ratio is not declining, then the probability of default increases. This is because it becomes more difficult to service the debt without reducing consumption. Stein and Lim found inter alia that both Thailand and Korea exhibited warning signals of excess debt: there was a rise in the debt/GDP ratio, and a fall in relative returns 1994–96 in both cases. The authors then compare the forecasts of the NATREX and excess debt models, and their interaction, with the events in east Asia 1997–98.
Volatility and risk
Volatility, in the view of Poon and Granger (2003, pp. 481, 492), is a latent variable, and, unlike price, cannot be observed, but needs to be estimated, if inferences about volatility are to be drawn. This would appear to contrast, to some extent, with the view of Andersen, Bollerslev, Diebold and Labys (2003) (henceforth ABDL), who, in proposing their concept of realized volatility, claim that empirically, they are “treating volatility as observed rather than latent” (ABDL, p. 581), although realized volatility (RV) still needs to be estimated. In any case, volatility is not identical to risk: while a sample standard deviation can be employed as an estimate of volatility, an inference about risk requires that this estimate be attached to a statistical distribution, either theoretical or empirical. Poon and Granger (2003) agree that volatility can be interpreted as uncertainty, although they believe that in such cases there is usually an implicit assumption about the distribution of returns (Poon and Granger, 2003, p. 480).
This section of the Introduction deals with five papers which address a range of issues in the areas of volatility and risk. Chapter 3 deals with the trading characteristics of instruments for managing and taking risk on China’s futures exchanges, while Chapter 4 surveys recent contributions to the literature on these instruments in agricultural economics. Chapter 5 discusses the application of Fourier analysis to intraday data, which are not evenly spaced in time, to avoid problems from homogenizing and synchronizing the data. Chapter 6 discusses the distributional properties of realized volatilities estimated from intra-day data for a thinly traded currency futures market, while Chapter 7 is concerned with the development of a model to produce risk-adjusted returns with data from a leading currency futures market.
Recent developments in Chinese futures markets
A developed cash market and a system of warehouse receipts, both important foundations for the support of futures markets in agricultural commodities, were late developments in China. Nevertheless, the China Zhengzhou Commodity Exchange (CZCE), acting on advice from the Chicago Board of Trade, opened a wholesale market in 1990, and futures trading began on CZCE in May 1993. By the end of 1993 there were more than 30 futures exchanges operating in China, although this number was reduced by Chinese regulatory authorities to 14 by the end of 1995, and to three in 1998, namely CZCE (known as the Zhengzhou Commodity Exchange or ZCE since 1998), the Dalian Commodity Exchange and the Shanghai Futures Exchange (Peck, 2001, pp. 445, 452–454). Futures trading on these three exchanges, which is all electronic, centred on commodities, especially mungbeans at ZCE, soybeans at Dalian and copper at Shanghai. Trading activity on China’s futures exchanges reached a peak in 1995 of 667 million contracts (see Chapter 3) or approximately ten trillion yuan (Peck, 2001, p. 454), and thereafter declined until around 2000, from which time there has been a revival. New futures contracts, mostly listed since 2000, have played an important part in the recovery in trading volumes on China’s futures exchanges in 2005 and 2006. These commodities include especially strong gluten wheat, white sugar and cotton on ZCE, corn, soybean oil and meal on Dalian, and aluminium, rubber and fuel oil on Shanghai. Of the commodities which previously were strong performers on these exchanges, mungbeans have faded into oblivion at ZCE, although soybeans were a strong performer at Dalian in 2005, as was copper at Shanghai in the same year (http://english.czce.com.cn www.dce.cn www.shfe.com.cn all accessed August 18, 2006).
In a previous paper Peck was able to point to the speculative interest and activity by commercials on ZCE prior to 1998. This was in contrast to trading in wheat futures in Kazakhstan, which was in decline. The comparative success of ZCE, which was the most successful of the Chinese exchanges up to that date, Peck attributed in no small part to the managerial ability of the exchange officials (Peck, 2000, p. 54).
In Chapter 3, Peck discusses trading patterns and aspects of the performance of Chinese futures exchanges which have received little attention in the literature. Trading on China’s futures exchanges typically reaches a maximum some five to seven months prior to maturity. This is true of soybeans at Dalian, of wheat at Zhengzhou, and of copper at Shanghai (the peak for aluminium at Shanghai is three to four months prior to maturity). Moreover, open interest follows the same course. This is in contrast to trading volume in the US, the UK, continental Europe and most other places, where the most active future is typically two to three months from maturity. Peck refers to a study which claims that the Chinese characteristic is due to the rules of Chinese exchanges, which require greater margins and smaller position limits in the month prior to delivery. Peck also seeks evidence of seasonality in Chinese trading patterns, and finds some surprising contrasts compared with US exchanges, especially for grains.
In Chapter 3, Peck also reviews the literature on performance of China’s futures markets, including studies of the links between futures and cash prices in China, and between Chinese and US futures prices, for commodities which are traded...
Table of contents
- Cover Page
- Title Page
- Copyright Page
- Figures
- Tables
- Charts
- Contributors
- Acknowledgements
- 1 Editor’s introduction
- 2 Asian crises
- 3 The development of futures markets in China
- 4 Issues and research opportunities in agricultural futures markets
- 5 Currency futures volatility during the 1997 East Asian crisis
- 6 Distributional properties of returns in thin futures markets
- 7 Simultaneity, forecasting and profits in the US dollar/Deutschemark futures market
- 8 Perceptions of futures market liquidity
- 9 Simultaneity and liquidity in US electricity futures
Frequently asked questions
Yes, you can cancel anytime from the Subscription tab in your account settings on the Perlego website. Your subscription will stay active until the end of your current billing period. Learn how to cancel your subscription
No, books cannot be downloaded as external files, such as PDFs, for use outside of Perlego. However, you can download books within the Perlego app for offline reading on mobile or tablet. Learn how to download books offline
Perlego offers two plans: Essential and Complete
- Essential is ideal for learners and professionals who enjoy exploring a wide range of subjects. Access the Essential Library with 800,000+ trusted titles and best-sellers across business, personal growth, and the humanities. Includes unlimited reading time and Standard Read Aloud voice.
- Complete: Perfect for advanced learners and researchers needing full, unrestricted access. Unlock 1.5M+ books across hundreds of subjects, including academic and specialized titles. The Complete Plan also includes advanced features like Premium Read Aloud and Research Assistant.
We are an online textbook subscription service, where you can get access to an entire online library for less than the price of a single book per month. With over 1.5 million books across 990+ topics, we’ve got you covered! Learn about our mission
Look out for the read-aloud symbol on your next book to see if you can listen to it. The read-aloud tool reads text aloud for you, highlighting the text as it is being read. You can pause it, speed it up and slow it down. Learn more about Read Aloud
Yes! You can use the Perlego app on both iOS and Android devices to read anytime, anywhere — even offline. Perfect for commutes or when you’re on the go.
Please note we cannot support devices running on iOS 13 and Android 7 or earlier. Learn more about using the app
Please note we cannot support devices running on iOS 13 and Android 7 or earlier. Learn more about using the app
Yes, you can access Debt, Risk and Liquidity in Futures Markets by Barry Goss in PDF and/or ePUB format, as well as other popular books in Business & Business General. We have over 1.5 million books available in our catalogue for you to explore.