Although the United States has always been a nation of immigrants, the recent demographic shifts resulting in burgeoning young Latino and Asian populations have literally changed the face of the nation. This wave of massive immigration has led to a nationwide struggle with the need to become bicultural, a difficult and sometimes painful process of navigating between ethnic cultures.
While some Latino adolescents become alienated and turn to antisocial behavior and substance use, others go on to excel in school, have successful careers, and build healthy families. Drawing on both quantitative and qualitative data ranging from surveys to extensive interviews with immigrant families, Becoming Bicultural explores the individual psychology, family dynamics, and societal messages behind bicultural development and sheds light on the factors that lead to positive or negative consequences for immigrant youth. Paul R. Smokowski and Martica Bacallao illuminate how immigrant families, and American communities in general, become bicultural and use their bicultural skills to succeed in their new surroundings The volume concludes by offering a model for intervention with immigrant teens and their families which enhances their bicultural skills.
eBook - ePub
Becoming Bicultural
Risk, Resilience, and Latino Youth
- 256 pages
- English
- ePUB (mobile friendly)
- Available on iOS & Android
eBook - ePub
About this book
Trusted by 375,005 students
Access to over 1.5 million titles for a fair monthly price.
Study more efficiently using our study tools.
Information
1
From Melting Pot to Simmering Stew
Acculturation, Enculturation, Assimilation, and Biculturalism in American Racial Dynamics
On January 20, 2009, Barack Obama was sworn in as the forty-fourth president of the United States. Although he was heralded as the first African American to serve in the highest and most powerful position in the nation (and perhaps in the world), President Obama’s cultural heritage was more subtle and complex. He was born in Honolulu, Hawaii, to an American mother, Stanley Ann Dunham, whose family (in Wichita, Kansas) was primarily of English descent, and Barack Obama Sr., a Luo from Nyang’oma Kogelo, Nyanza Province, Kenya. His father and mother married in 1961 and divorced in 1964, after which his father returned to Kenya.
After her divorce, Dunham married Indonesian student Lolo Soetoro. In 1967 they moved the family to Indonesia, where Barack attended schools in Jakarta from ages six to ten. He finished his schooling (grades five to twelve) in Honolulu while living with his maternal grandparents. Thus, not only was Obama of mixed race, but he also grew up in a state where more than 25 percent of the population reports a heritage of two or more races. The multicultural environment in Hawaii influenced his cultural perspective. Obama wrote,
That my father looked nothing like the people around me—that he was black as pitch, my mother white as milk—barely registered in my mind. … The opportunity that Hawaii offered—to experience a variety of cultures in a climate of mutual respect—became an integral part of my world view, and a basis for the values that I hold most dear. (Obama 1995)
This mixed-race heritage and multicultural childhood provided the foundation for Obama to become the first biracial and bicultural president. His campaign appealed to young voters and minorities. Overall, 68 percent of voters between the ages of eighteen and twenty-nine years cast their ballots for Obama, versus 30 percent of that age group who supported John McCain (Hebel 2008). Fifty-two percent of the 30- to 44-year-olds supported Obama. Final exit-poll tallies indicated that Obama won the Asian American vote 62 percent to 35 percent, the Latino vote 67 percent to 31 percent, and the African American vote 90 percent to 10 percent (Chen 2009). Certainly, Obama’s biracial heritage and multicultural skills catalyzed a trend among younger generations and allowed him to connect with diverse groups of voters. He is widely praised for his ability to listen to many perspectives and seek common ground in making decisions.
Further raising the visibility of biculturalism in the United States, Sonia Sotomayor was confirmed by the United States Senate on August 6, 2009, as the first Latina Supreme Court justice. Sotomayor was born in the Bronx, a borough of New York City, to Juan Sotomayor, who was from the area of Santurce, San Juan, Puerto Rico, and Celina Báez from Santa Rosa in Lajas, a rural area on Puerto Rico’s southwest coast. Spanish was her first language and her family regularly visited Puerto Rico to see relatives during the summers. Sotomayor became fluent in English later in childhood, and was inspired to pursue a legal career through reading Nancy Drew novels and watching Perry Mason on television.
The life stories of Obama and Sotomayor encapsulate many of the themes in bicultural development. Both of these individuals grew up in racially diverse environments with meager resources and single parents who were determined to get their children ahead through education and hard work. Obama and Sotomayor both struggled through a process of cultural identity development, but eventually were able to navigate within and across complex institutional settings, engaging disparate groups of people with their sophisticated communication skills and insight into complicated social issues. Having succeeded in meeting the many challenges inherent in the acculturation process (e.g., learning new languages, coping with discrimination, adopting norms and behaviors to meet the needs of different cultural situations), Obama and Sotomayor serve as examples of the twenty-first-century bicultural American Dream that is characterized by maintaining one’s cultural roots while successfully meeting the demands of the larger sociocultural system.
Although Barack Obama and Sonia Sotomayor are currently two of the most famous biracial, bicultural people in the United States, they represent millions of other bicultural people. U.S. Census data from 2000 show that 1.9 percent of whites; 0.6 percent of African Americans, American Indian/Alaskan Natives, and Asians; 0.2 percent of Native Hawaiian/Pacific Islanders; and 1.1 percent of people reporting other racial heritages claim a heritage of more than one racial group (U.S. Census Bureau 2007). These percentages sum to 14,168,760 people in the United States who claim a mixed racial heritage (5,470,349 combination with white; 1,761,244 combination with African American; 1,643,345 combination with American Indian/Alaskan Native; 1,655,830 combination with Asian; 475,579 combination with Native Hawaiian/Pacific Islander; and 3,162,413 combination with some other race). Moreover, these numbers include only those individuals who report biracial heritage. Many people may be bicultural but not biracial. These people are likely to affiliate with one racial or ethnic group but adopt perspectives from both their minority cultural group and the larger host culture within the United States. Given that nineteen million immigrants obtained legal resident status from 1990 to 2008 and approximately twelve million undocumented immigrants are trying to adjust to life within the U.S. cultural system (Department of Homeland Security 2008), it is clear that becoming bicultural is a common theme for many people throughout the United States.
Demographic Change in the United States
The racial and ethnic makeup of the U.S. has changed more rapidly since 1965 than during any other period in history. The reform in immigration policy of 1965, the increase in self-identification by ethnic minorities, and the slowing of the country’s birth rates, especially among non-Hispanic White Americans, have all led to an increasing, and increasingly diverse, racial and ethnic minority population in the United States. (U.S. Department of Health and Human Services 2001, 56)
As the surgeon general’s report Mental Health: Culture, Race, and Ethnicity cited above indicates, the United States is currently experiencing the largest growth of racial and ethnic minority populations in its history (see also Suarez-Orozco and Suarez-Orozco 2001). As shown in figure 1.1, during the eighteen years between 1990 and 2008, nearly nineteen million immigrants obtained legal resident status in the United States. The only other decade that approaches the highest immigration rates from 1990–2000 (9,775,398) or 2000–2008 (9,168,612) was at the turn of the twentieth century, when 8,202,388 immigrants obtained legal resident status from 1900 to 1910.
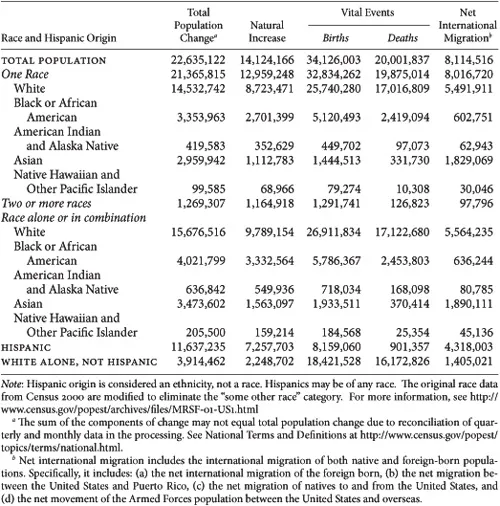
National statistics illustrate dramatic demographic changes. In July 2006, the U.S. minority population reached 100.7 million, which equates to one in three residents of the nation having minority status (U.S. Census Bureau 2007a). The nation’s overall minority population on July 1, 2008, was 104.6 million or 34 percent of the total population (U.S. Census Bureau 2009). Hispanics or Latinos are the largest and fastest-growing minority group, which reached 46.9 million in 2008, an increase of 3.2 percent from 2007. In 2008, nearly one in six U.S. residents was Hispanic. Asians were the second fastest-growing minority group from 2007 to 2008, increasing by 2.7 percent to 15.5 million persons in 2008. Following the Asian population in growth were Native Hawaiians and other Pacific Islanders (increasing 2.4 percent to 1.1 million), American Indians and Alaska Natives (increasing 1.7 percent to 4.9 million) and blacks or African Americans (increasing 1.3 percent to 41.1 million). In 2008, 5.2 million people were recorded as being biracial or multiracial, which was a 3.4 percent increase from 2007. The population of non-Hispanic whites who indicated no other race showed the smallest growth, increasing by 0.2 percent to 199.5 million. Table 1.1 highlights United States demographic shifts from 2000 to 2008 by race and ethnicity (U.S. Census Bureau 2009).
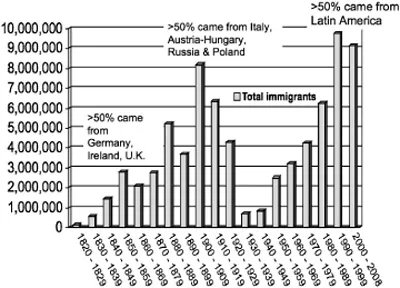
Fig. 1.1. Immigrants obtaining permanent legal resident status, 1820–2008 (U.S. Department of Homeland Security 2008)
Dynamic demographic changes are occurring across the nation, specifically in the majority-minority balance. A population is defined as having majority-minority status when more than half the population is a group other than single-race, non-Hispanic whites. The most recent report on the shift in the majority-minority status of counties, issued by the U.S. Census Bureau in 2009, showed that as of July 1, 2008, nearly 10 percent (309) of the nation’s 3,142 counties were majority-minority status; of that total, 56 have become majority-minority status since April 1, 2000. Taking a wider perspective, four states had majority-minority status in 2008: Hawaii (75 percent), New Mexico (58 percent), California (58 percent), and Texas (53 percent). The District of Columbia was 67 percent minority. No other state had more than a 43 percent minority population.
The Pew Research Center estimates that by 2050, Latinos will make up nearly one-third of the U.S. population and that non-Latino whites will become a minority constituting 47 percent of the U.S. population. African Americans will continue to make up 13 percent of the population, and the percentage of Asian/Pacific Islanders will increase from 5 percent in 2005 to 9 percent in 2050. Foreign-born immigrants will rise from 12 percent of the U.S. population in 2005 to 19 percent in 2050. According to the Pew Research Center projections, immigrants who arrive after 2005, and their U.S.-born descendants, may account for up to 82 percent of the increase in the national population during the 2005–2050 period (Passel and Cohn 2008).
TABLE 1.1
Cumulative Estimates of the Components of Resident Population Change by Race and Hispanic Origin for the United States: April 1, 2000, to July 1, 2008 (Census Data)
Cumulative Estimates of the Components of Resident Population Change by Race and Hispanic Origin for the United States: April 1, 2000, to July 1, 2008 (Census Data)
While approximately 44 percent of Latinos live in the western United States (Current Population Survey 2002), the impact of Latin American immigration is becoming widespread. From 1990 to 2000, the Latino population in seven states increased by 200 percent or more. At least twenty-five additional states had increases between 60 percent and 199 percent. Although Texas, California, and New York saw increases below the national average of 60 percent, these states already had large Latino populations. Some of the states, such as Georgia and North Carolina, where the growth of the Latino population was largest between 1990 and 2000, are not traditional areas for this type of immigration. North Carolina is one example of the seven states where the Latino population burgeoned during the past decade, increasing nearly 400 percent from 76,726 individuals in 1990 to 378,963 individuals in 2000. In contrast, during the same time, North Carolina’s overall rate of population growth was only 15 percent (U.S. Census Bureau 2001a). In 2000, Latinos constituted 4.7 percent of North Carolina’s total population (U.S. Census Bureau 2009). With an increase of 655 percent, Mexican immigrants are the largest subgroup driving this trend in North Carolina. The remarkable growth of the Latino population, and the movement of this population into diverse geographic areas of the United States, is illustrated by the fact that between 2000 and 2007, the number of Latinos grew in all but 150 of the 3,141 U.S. counties. That is, 2,991 U.S. counties reported an increase in the Latino population between 2000 and 2007.
These trends are even more pronounced for children. Children and adolescents represent significant proportions of the growing racial and ethnic minority populations (U.S. Census Bureau 2007a). Currently, one-fourth of the U.S. population is younger than eighteen years old. In contrast, youth younger than eighteen years comprise a third of the Latino population, nearly a third of the Asian/Pacific Islander population, and slightly more than a fourth of the American Indian/Alaskan Native population. Foreshadowing anticipated results for the 2010 Census, the Census Bureau (2009) has estimated that nearly half (47 percent) of the nation’s children younger than five years were a minority in 2008, with 25 percent being Hispanic/Latino. For all children under eighteen years, 44 percent had minority status and 22 percent were Hispanic/Latino. Latinos are not only driving U.S. population growth, but they are the only demographic group producing families large enough to sustain the population (the population is sustained when two parents have two or more children). Recent Census Bureau figures report the average number of children for Asian couples as 1.7 children, 1.8 for non-Latino whites, 2.0 for African Americans, and 2.3 for Latinos (U.S. Census Bureau 2009). Societies that have an average of less than two children per family become dependent on immigration to maintain social stability and the labor force.
The Hispanic/Latino population is much younger than the population as a whole, with a median age of 27.7 years in 2008, compared with 36.8 years for the total U.S. population. Thirty-four percent of the Hispanic/Latino population was younger than eighteen years and 6 percent age sixty-five or older, as compared to 24 percent and 13 percent, respectively, for the total population (U.S. Census Bureau 2009). The combination of rapid growth and young age of the Hispanic/Latino population suggests that this group will have a profound impact on the future of the United States. As the aging non-Hispanic white workforce retires, they are likely to be replaced by young Latino workers. Considering the rapid growth and relative youth of the minority population, it is critical that we focus attention on promoting the health, well-being, and academic achievement of minority children, particularly Latino youth, given their substantial role in the future of the United States.
The rise in the U.S. Latino population is the result of immigration of youth and families born in other countries as well as high birth rates among Latino families. In 2004, approximately a quarter of the U.S. Latino population reported non-U.S. nativity, with the largest percentage coming from Mexico, followed by Puerto Rico and other Central American countries (U.S. Census Bureau 2007b). A majority of Latino immigrants have come to the United States since 1990, clearly demonstrating that a large segment of the Latino population is still adjusting to life in this country. Of the nearly three-quarters of the Latino population who are U.S. citizens, approximately 61 percent are U.S. born and are associated with the significantly higher birth rate among Latino women relative to non-Hispanic white women (U.S. Census Bureau 2007c). Given the number of these young Latino workers who are also recent immigrants, these statistics also underscore that a substantial group of adolescents is likely to be wrestling with acculturation-related issues during formative stages in their development.
From 1986 to 2006, Mexico had been the country-of-origin for the most foreign-born immigrants admitted to the United States for legal permanent residence, with more than double the number of immigrants compared to the next country-of-origin on the list (U.S. Department of Homeland Security 2008). During 2008, the top countries-of-origin for immigrants obtaining permanent legal residence were Mexico (188,015); Caribbean nations such as Cuba, the Dominican Republic, Haiti, and Jamaica (134,744); all of Europe (121,146); all of Africa (100,881); all of South America (96,178); China (75,410); India (59,728); the Philippines (52,391); and Russia (45,092). In addition to these authorized immigrants, the Department of Homeland Security’s Office of Immigration Statistics estimates that there were about 11.5 million unauthorized migrants in 2006, of which 6.6 million, or 57 percent, were Mexican born.
The remarkable growth of the Asian/Pacific Islander population is also fueled by both recent immigration of Asian individuals and greater-than-average birth rates of both Asian and Pacific Islander families (U.S. Census Bureau 2007d). For instance, approximately 33 percent of the current Asian population came to the United States during the 1990s, and an additional 17 percent immigrated since 2000. A majority of these immigrants originated in either China or Japan, and became residents in Hawaii. In contrast, 78 percent of Pacific Islanders are native. In addition, Asian/Pacific Islander women are significantly more likely to have children than their non-Hispanic white counterparts (U.S. Census Bureau 2007e).
Although Latinos and Asians dominate the foreign-born U.S. population, these are not the only minority groups showing significant growth. Currently, there are more than 550 federally recognized American Indian tribes and Alaskan Native groups (U.S. Department of the Interior 2007). In 2004, approximately 2.2 million persons identified themselves as American Indian/Alaskan Native and an additional 1.9 million self-identified as being mixed heritage of American Indian/Alaskan Native and another race (U.S. Census Bureau, 2007f). Further, the American Indian/Alaskan Native population continues to grow at a relatively higher rate than the general population, as evidenced by the 65 percent increase that was experienced from 1990 to 2007 (Indian Health Service 2007). In part, this rate of growth is a result of American Indian/Alaskan Native women having relatively higher birth rates than non-Hispanic white women. In addition, American Indian adolescent mothers aged fifteen to nineteen years have the second highest birth rate (67.8 per 1,000) compared with African American (63.1 per thousand) and Hispanic (82.6 per thousand) adolescent mothers (Martin et al. 2006).
The minority population in the United States is important not only because it is growing rapidly but also because of the risk factors this heterogeneous group faces. Compared to non-Latino whites, Latinos are more likely to be younger than eighteen years, unemployed, residing in large family households, and living in poverty (U.S. Census Bureau 2001b; Ramirez and de la Cruz 2003). In addition, Latinos have a lower median age (twenty-five years compared to twenty-seven years for African Americans and thirty-one years for non-Latino whites), lower educational attainment, and lower income levels than non-Latino whites. In 2000, the median income for Latino men was $19,833, compared to $21,662 for African American men and $31,213 for non-Latino white men (U.S. Census Bureau 2001a). Similarly, Latino women had the lowest median incomes ($12,255) in 2000, compared to $16,081 for African American women and $16,805 for non-Latino white women (U.S. Census Bureau 2001a). Considering that the 2000 federal poverty threshold for a family of four was $17,463, many Latino families are coping with socioeconomic disadvantage. Official estimates report the Latino poverty rate at 22 percent, which is identical to the rate for African Americans, but nearly three times the non-Latino white rate of 7.8 percent (U.S. Census Bureau 2001a). In 2007, the poverty rates were 21.5 percent for Latinos, 24.5 for African Americans, 10.2 percent for Asians, and 8.2 percent for non-Hispanic whites (U.S. Census Bureau 2009). With many minority families experiencing socioeconomic disadvantages and challenges associated with recent immigration, it is important to turn our ...
Table of contents
- Cover Page
- Title Page
- Copyright Page
- Dedication
- Contents
- list of Figures
- list of Tables
- Acknowledgments
- 1 From Melting Pot to Simmering Stew:
- 2 Enculturation after Immigration:
- 3 From Contact to Conflict:
- 4 Balancing between Two Worlds:
- 5 Cultural Adaptation Styles and Health:
- 6 The Benefits of Biculturalism:
- 7 Entre Dos Mundos/Between Two Worlds:
- References
- Index
- About the Author
Frequently asked questions
Yes, you can cancel anytime from the Subscription tab in your account settings on the Perlego website. Your subscription will stay active until the end of your current billing period. Learn how to cancel your subscription
No, books cannot be downloaded as external files, such as PDFs, for use outside of Perlego. However, you can download books within the Perlego app for offline reading on mobile or tablet. Learn how to download books offline
We are an online textbook subscription service, where you can get access to an entire online library for less than the price of a single book per month. With over 1.5 million books across 990+ topics, we’ve got you covered! Learn about our mission
Look out for the read-aloud symbol on your next book to see if you can listen to it. The read-aloud tool reads text aloud for you, highlighting the text as it is being read. You can pause it, speed it up and slow it down. Learn more about Read Aloud
Yes! You can use the Perlego app on both iOS and Android devices to read anytime, anywhere — even offline. Perfect for commutes or when you’re on the go.
Please note we cannot support devices running on iOS 13 and Android 7 or earlier. Learn more about using the app
Please note we cannot support devices running on iOS 13 and Android 7 or earlier. Learn more about using the app
Yes, you can access Becoming Bicultural by Paul R. Smokowski,Martica Bacallao in PDF and/or ePUB format, as well as other popular books in Psychology & Developmental Psychology. We have over 1.5 million books available in our catalogue for you to explore.