The Measure of America, 2010-2011, is the definitive report on the overall well-being of all Americans. How are Americans doing—compared to one another and compared to the rest of the world? This important, easy-to-understand guide will provide all of the essential information on the current state of America.
This fully illustrated report, with over 130 color images, is based on the groundbreaking American Human Development Index, which provides a single measure of the well-being for all Americans, disaggregated by state and congressional district, as well as by race, gender, and ethnicity. The Index rankings of the 50 states and 435 congressional districts reveal huge disparities in the health, education, and living standards of different groups. For example, overall, Connecticut ranked first among states on the 2008-2009 Index, and Mississippi ranked last, suggesting that there is a 30-year gap in human development between the two states. Further, among congressional districts, New York’s 14th District, in Manhattan, ranked first, and California’s 20th District, near Fresno, ranked last. The average resident of New York’s 14th District earned over three times as much as the average resident of California’s 20th District, lived over four years longer, and was ten times as likely to have a college degree.
The second in the American Human Development Report series, the 2010-2011 edition features a completely updated Index, new findings on the well-being of different racial and ethnic groups from state to state, and a closer look at disparities within major metro areas. It also shines a spotlight on threats to progress and opportunity for some Americans as well as highlighting tested approaches to fosteringresilience among different groups.
Using a revelatory framework for explaining the very nature of humanprogress, this report can be used not only as a way to measure America but also to build upon past policy successes, protect the progress made over the last half century from new risks, and create an infrastructure of opportunity that can serve a new generation of Americans. Beautifully illustrated with stunning four-color graphics that allow for a quick visual understanding of often complex but important issues, The Measure of America is essential reading for all Americans, especially for social scientists, policy makers, and pundits who want to understand where Americans stand today.
eBook - ePub
The Measure of America, 2010-2011
Mapping Risks and Resilience
- 336 pages
- English
- ePUB (mobile friendly)
- Available on iOS & Android
eBook - ePub
About this book
Trusted by 375,005 students
Access to over 1.5 million titles for a fair monthly price.
Study more efficiently using our study tools.
Information
CHAPTER 1
What the American Human Development Index Reveals

IN THIS SECTION:
Introduction
Historical Trends: A Half Century of Development Progress
Presenting American Human Development Index Scores
Conclusion
How Do We Stack Up?
Human Development Index
Introduction
“Our gross national product … if we should judge America by that—counts air pollution and cigarette advertising, and ambulances to clear our highways of carnage. It counts special locks for our doors and the jails for those who break them. It counts the destruction of our redwoods and the loss of our natural wonder in chaotic sprawl…. Yet the gross national product does not allow for the health of our children, the quality of their education, or the joy of their play…. It measures neither our wit nor our courage; neither our wisdom nor our learning …. it measures everything, in short, except that which makes life worthwhile. And it tells us everything about America except why we are proud that we are Americans.”
ROBERT F. KENNEDY, 1968
Gross domestic product (GDP) is a vital measure. Tracking the expansion and contraction of market activity and production tells a crucial part of a nation’s story—but an incomplete one. Complementing GDP with data on the health, education, and income of the typical American along with information about who among us has—or lacks—access to the basic building blocks of opportunity allows for a richer, more comprehensive understanding of how we are faring. By using only GDP growth and other strictly economic metrics to gauge societal success, we risk overlooking significant disparities in fundamental areas of human well-being. Without a more comprehensive assessment of human development, we can fall short of our goals without even knowing it. On several important gauges, including the infant death rate, the child poverty rate, and the on-time high school graduation rate, America has slipped behind other countries in recent years. But our relatively high GDP has enabled policymakers to downplay these troubling realities. What we don’t measure, we don’t address.
What we don’t measure, we don’t address.
To expand opportunities for people to lead lives that are long, healthy, safe, and free, with the capabilities to thrive rather than merely to survive, we must first understand how ordinary people are doing.
The American Human Development Index:
• Paints a far more detailed portrait of well-being and opportunity throughout the United States than does GDP alone, and this portrait…
• Enables us to better analyze the interlocking factors that fuel advantage and disadvantage, create opportunities, and determine life chances. Because it uses easily understood indicators that we can compare across geographic regions and over time, it…
• Provides a standard frame of reference, enabling us to make apples-to-apples comparisons from place to place and from year to year.
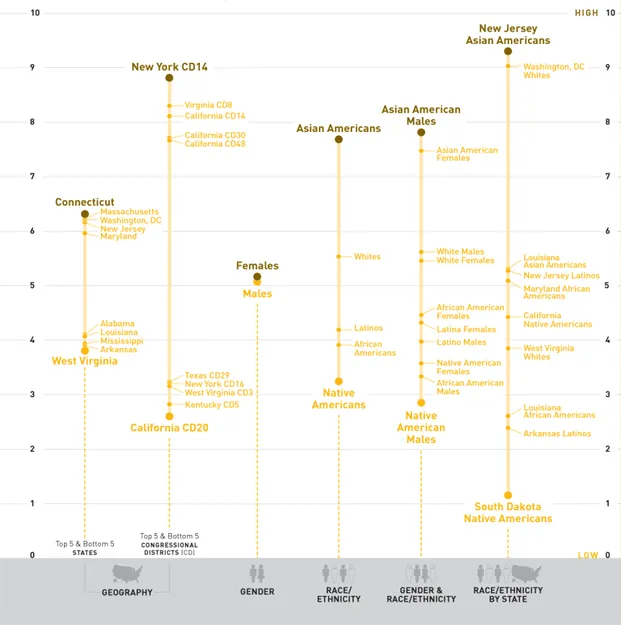
The American HD Index is expressed in numbers from 0 to 10. The Index score for the whole country is 5.17, a moderate upward tick from 5.05 in The Measure of America 2008–2009. The overall Index score comprises scores related to the human condition in different states, congressional districts, and major metropolitan areas, broken down by race, ethnicity, and sex. Some populations enjoy levels of well-being near the top of the 10-point scale, others fall slightly above or below the U.S. average, and some have levels of health, education, and earnings that place them near the bottom of the Index.
Connecticut is the top-ranked state, with an HD Index score of 6.30. If current national trends continue, we would expect the U.S. national score to reach Connecticut’s level in the year 2022. Connecticut was the top-ranked state in the 2008–09 Index as well. But not all states have progressed at the same pace. Arkansas, for example, dropped two places in the state rankings. It is now the next-to-last state, with human development levels roughly equivalent to well-being conditions in America nearly two decades ago. If we compare Arkansas to Connecticut, we see a gap in human development of about three decades; in other words, more than a generation of human progress separates Connecticut from Arkansas.
The Index enables us to make apples-to-apples comparisons from place to place and from year to year.
The good news is that some Americans are experiencing the longest life spans in human history while expanding their choices through high levels of educational attainment and earning incomes that make comfortable and secure living standards possible for themselves and their families. Asian Americans in New Jersey are living, on average, nearly ninety-two years. Two in three adult Asian Americans have earned a bachelor’s degree or higher, and their median personal earnings are 68 percent above the national median.
The bad news is that many Americans do not enjoy equivalent levels of well-being. If current trends continue, the country as a whole will not reach the levels of health, education, and income prevalent among Asian Americans in New Jersey for another fifty years. Decades of progress in health, education, and earnings have bypassed certain groups. For instance, Native Americans in South Dakota lag almost a half century behind the rest of the nation in the categories measured by the American HD Index, living, on average, sixty-six years, and earning less than the typical American did in 1960. The typical Asian American in New Jersey lives an astonishing quarter of a century longer, is eleven times more likely to have a graduate degree, and earns $33,149 more per year than the typical Native American in South Dakota. The gap in incomes exceeds the entire median earnings of American workers (about $30,000). Separating Native Americans in South Dakota and Asian Americans in New Jersey is a century of human development progress. The category “Asian American” can include people who trace their heritage to a wide range of countries. See BOX 1 for further discussion of important differences within various racial and ethnic groups.
This chapter introduces the American HD Index using 2007 and 2008 data, the most recent years for which the required data are available nationally. In addition, this chapter provides detailed findings about variations in human development based on analysis by geography, gender, race, and ethnicity. Subsequent chapters explore the reasons behind these variations, considering health, education, and income, and the interplay of these three basic areas in terms of the freedoms and opportunities they afford for different groups of Americans.
BOX 1 broad Racial and Ethnic Labels Mask Considerable Diversity
The American Human Development Index is calculated using official government data and the racial and ethnic categories defined by the White House Office of Management and Budget. While these data sources and categorizations make possible reliable comparisons across the nation, they limit our ability to reflect the vast diversity that exists within racial and ethnic groups.
Broad categories like “Asian American” or “Latino” include people from wildly disparate origins. For instance, the category “African Americans” includes descendants of slaves as well as newly arrived immigrants from Africa or parts of the Caribbean. Asian Americans are descendants of peoples originating in East Asia, Southeast Asia, or the Indian subcontinent. Latinos trace their ancestry to countries throughout the Americas and parts of Europe. Whites range from descendants of passengers on the Mayflower to recently arrived Bosnian refugees.
This point is best illustrated with a concrete example. Asian Americans are sometimes touted as a “model minority” to which other racial and ethnic groups should aspire. This stereotype tends both to undervalue the opportunities and constraints with which immigrant groups arrive in the United States and to overemphasize the homogeneity of the Asian American category.
Two in three Asian Americans are foreign-born,1 a notably higher proportion than for other major racial and ethnic groups, and considerable variation in human development outcomes exists depending upon country of origin.
Cambodians, Laotians, and Hmong register far lower on many human development dimensions than Indians and Japanese, for example. While fewer than 7 percent of Japanese adults lack a high school diploma, a full 40 percent of Hmong have not graduated high school.2 Median family income for Indians in 2008 was nearly $100,000 and for Japanese families, it was $83,500, compared to $60,000 for Vietnamese families, less than the median family income for the United States as a whole.3 Human development levels also vary considerably by gender among Asian Americans in general and within different Asian ancestral groups.
Even when the differences in starting points for Asian Americans of different origins are held constant, however, Asian Americans generally best other groups on a wide array of human development outcomes, a reality that poses interesting questions for researchers.4
Race and ethnicity offer just one lens through which to examine opportunity and freedom. But although the differences within groups can be as large as those between them, the chasms in human development revealed by comparing U.S. racial and ethnic groups present strong evidence that these categories retain great salience in assessing well-being.
Historical Trends: A Half Century of Development Progress
In recent decades, human development has improved dramatically in the United States (see TABLE 1). The average American today lives nearly nine years longer than an American in 1960, is twice as likely to have graduated from high school, is almost four times as likely to earn a bachelor’s degree, and earns nearly twice as much (adjusted for inflation).
However, once-rapid progress has slowed to a crawl in this first decade of the twenty-first century. Between 2005 and 2008 the HD Index value for the United States as a whole rose 0.12 points—from 5.05 to 5.17. ...
Table of contents
- Cover Page
- Title Page
- Copyright Page
- Contents
- Boxes, Figures, Maps, and Tables
- Foreword
- Acknowledgments
- Key Findings
- Introduction
- Chapter 1 What the American human Development Index Reveals
- Chapter 2 A Long and healthy Life
- Chapter 3 Access to Knowledge
- Chapter 4 A Decent Standard of Living
- Conclusion
- Human Development Indicators
- References
- Footnotes
Frequently asked questions
Yes, you can cancel anytime from the Subscription tab in your account settings on the Perlego website. Your subscription will stay active until the end of your current billing period. Learn how to cancel your subscription
No, books cannot be downloaded as external files, such as PDFs, for use outside of Perlego. However, you can download books within the Perlego app for offline reading on mobile or tablet. Learn how to download books offline
Perlego offers two plans: Essential and Complete
- Essential is ideal for learners and professionals who enjoy exploring a wide range of subjects. Access the Essential Library with 800,000+ trusted titles and best-sellers across business, personal growth, and the humanities. Includes unlimited reading time and Standard Read Aloud voice.
- Complete: Perfect for advanced learners and researchers needing full, unrestricted access. Unlock 1.5M+ books across hundreds of subjects, including academic and specialized titles. The Complete Plan also includes advanced features like Premium Read Aloud and Research Assistant.
We are an online textbook subscription service, where you can get access to an entire online library for less than the price of a single book per month. With over 1.5 million books across 990+ topics, we’ve got you covered! Learn about our mission
Look out for the read-aloud symbol on your next book to see if you can listen to it. The read-aloud tool reads text aloud for you, highlighting the text as it is being read. You can pause it, speed it up and slow it down. Learn more about Read Aloud
Yes! You can use the Perlego app on both iOS and Android devices to read anytime, anywhere — even offline. Perfect for commutes or when you’re on the go.
Please note we cannot support devices running on iOS 13 and Android 7 or earlier. Learn more about using the app
Please note we cannot support devices running on iOS 13 and Android 7 or earlier. Learn more about using the app
Yes, you can access The Measure of America, 2010-2011 by Kristen Lewis,Sarah Burd-Sharps in PDF and/or ePUB format, as well as other popular books in Scienze sociali & Metodologia e ricerca nelle scienze sociali. We have over 1.5 million books available in our catalogue for you to explore.