Winner of the 2010 Distinguished Book Award from the American Psychological Association's 44th Division (the Society for the Psychological Study of Lesbian, Gay, Bisexual and Transgender Issues)
An in-depth, transnational primer on the current state of same-sex marriage post legalization
The summer of 2008 was the summer of love and commitment for gays and lesbians in the United States. Thousands of same-sex couples stood in line for wedding licenses all over California in the first few days after same-sex marriage was legalized. On the other side of the country, Massachusetts, the very first state to give gay couples marriage rights, took the last step to full equality by allowing same-sex couples from other states to marry there as well. These happy times for same-sex couples were the hallmark of true equality for some, yet others questioned whether the very bedrock of society was crumbling. What would this new step portend?
In order to find out the impact of same-sex marriage, M. V. Lee Badgett traveled to a land where it has been legal for same-sex couples to marry since 2001: the Netherlands. Badgett interviews gay couples to find out how this step has affected their lives. We learn about the often surprising changes to their relationships, the reactions of their families, and work colleagues. Moreover, Badgett is interested in the ways that the institution itself has been altered for the larger society. How has the concept of marriage changed? When Gay People Get Married gives readers a primer on the current state of the same-sex marriage debate, and a new way of framing the issue that provides valuable new insights into the political, social, and personal stakes involved.
The experiences of other countries and these pioneering American states serve as a crystal ball as we grapple with this polarizing issue in the American context. The evidence shows both that marriage changes gay people more than gay people change marriage, and that it is the most liberal countries and states making the first move to recognize gay couples. In the end, Badgett compellingly shows that allowing gay couples to marry does not destroy the institution of marriage and that many gay couples do benefit, in expected as well as surprising ways, from the legal, social, and political rights that the institution offers.

eBook - ePub
When Gay People Get Married
What Happens When Societies Legalize Same-Sex Marriage
- 307 pages
- English
- ePUB (mobile friendly)
- Available on iOS & Android
eBook - ePub
About this book
Trusted by 375,005 students
Access to over 1.5 million titles for a fair monthly price.
Study more efficiently using our study tools.
Information
Appendix 1
Constructing Measures and Making Comparisons
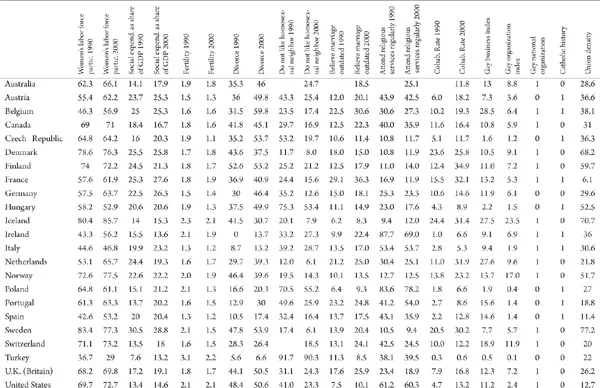
Using various international data sources, I created measures related to the efficiency and conflict theoretical stories for each country. To get a clearer sense of which factors were most important in potentially causing the change in laws, I focused on measures from the time before the laws were passed. With the exception of Denmark, all of the nine countries with laws enacted them after 1990, and Denmark’s law was passed in 1989. Therefore, the measures used here for looking at the first wave of countries come from 1990 or the early 1990s, and those for looking at the first and second waves together come from 1999 or 2000.
The appendix tables show the actual values of these measures for each country (Fig. A.1). Figure 9.1 in the text of the chapter compares average values for the countries with and without partnership laws.
Calculations from the World Values Survey provide several important variables.1 The WVS collects cross-sectional, individual-level data on values and norms for many different topics, including sexuality, gender, and homosexuality, in fifty different countries. Survey language and concepts were translated for each country and were administered by professional survey organizations in Western countries and elsewhere, mostly by local survey researchers.2 I have used only data from the second and fourth waves of the survey, conducted from 1990 to 1993 and from 1999 to 2000. Not all questions were asked in each country’s survey. Sample sizes ranged generally from 1,000 to almost 3,000 in the countries reported on in this book. All but a few countries have representative national samples of adults over 18 years old, selected through stratified multistage random sampling. Some countries oversampled particular subpopulations, such as younger age groups or racial groups, and the WVS provides individual sampling weights used here to account for oversampling within countries. Because the unit of analysis here is the country, I aggregated individual responses up to the country level. All of the attitude measures come from the WVS, as do the cohabitation rates per country.
Other data on demographic and economic measures come from the Organization for Economic Cooperation and Development (OECD), the European Union, and the International Labor Organization. My own counts of gay businesses and organizations come from the listings in the Spartacus Guide for Gay Men in 1990, a travel guide published annually. The data on national gay and lesbian political organizations come from the “Pink Book” summaries of the worldwide gay social movement published by the International Gay and Lesbian Association (ILGA) in 1985, 1988, and 1993.3
Multivariate Regression Method
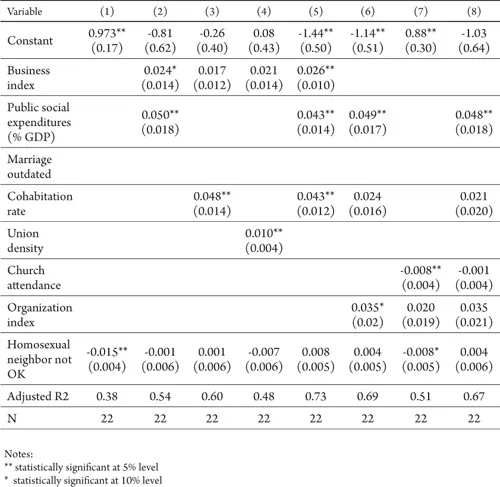
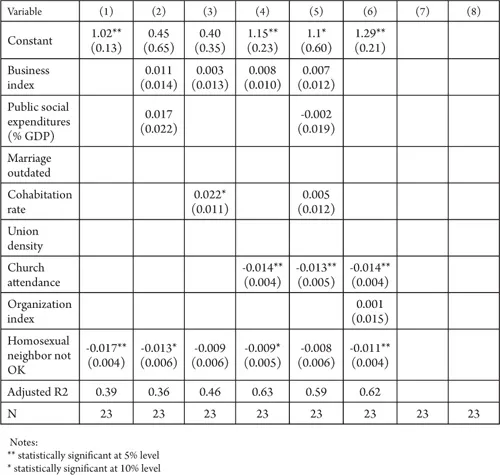
This method, using ordinary least squares estimation, calculates the impact of one independent or explanatory variable while holding the other variables constant. The dependent variable is one if a country has a same-sex partner recognition (SSPR) law and zero if it does not. Figure A.2 compares the first-wave of countries to all others; Figure A.3 compares the first- and second-waves countries to all other countries. Each column in Figures A.2 and A3 is a separate regression using just the variables with reported coefficients. Each coefficient shows the impact of a change in the independent variable on the probability of a country’s having an SSPR law, holding the other variables in the equation constant. For instance, in the first column of Figure A.2, the coefficient of –0.015 for “homosexual neighbor not OK” means that a country in which 40% of respondents say that they would not like a homosexual neighbor is 15% less likely to have an SSPR than is a country in which 30% of respondents do not want a homosexual neighbor. Rather than using a stepwise regression method, which is sensitive to the order in which variables are entered, I experimented with different specifications to retain variables that seemed to be important in different combinations. The small sample size limits the power of these tests and the number of variables that can be included, but the regressions demonstrate, first, that some explanatory factors are correlated with each other and, second, that some explanatory factors appear to be closely related to having an SSPR.4
Figure A.1
Country Values on Practical and Political Variables
Country Values on Practical and Political Variables
The regressions in Figures A.2 and A.3 test first for the importance of tolerant attitudes about homosexuality. The negative coefficients on the attitudes toward homosexuality variables in the initial specifications (i.e., columns) show that SSPRs are more likely when fewer residents of a country would not like to have homosexuals as neighbors. In other words, greater tolerance of homosexuality is associated with a higher likelihood of having an SSPR.
Notably, however, that effect diminishes and becomes statistically insignificant when other variables are entered into the equation, since many of the variables measured here are correlated with tolerance.5 Depending on the specific model, several other variables are associated with a statistically significant higher probability of an SSPR:
• Cohabitation often has a statistically significant and positive impact.
• The public social expenditures variable is positively related and significant in many specifications.
• In some regressions, the church attendance measure of religiosity is statistically significant and negatively related to having an SSPR.
Most other variables are not statistically significant in the bulk of the regressions, with a few exceptions. The business index is positively correlated with SSPRs, as predicted, but the value is small and never statistically significant except where it appears as the sole variable (not shown here). The only political power variable that is significant is the organization index, which is also positively correlated with SSPRs (both waves) but is only sometimes statistically significant.
Running regressions on just the SSPR countries to predict which would be first-wave innovators reveals few differences between the first and second waves when looking at 1990 values of variables. Greater tolerance of homosexual neighbors and higher social expenditures predicted passage in the first wave but were not always statistically significant. Using 2000 variable values, however, I found that higher cohabitation rates in 2000 and higher organizational index values were also associated with first-wave passage. In other words, the first-wave countries were the most tolerant of homosexuality and may have experienced greater political activism by gay organizations. The first-wave countries may have also been more tolerant of family diversity than the second-wave countries, as evidenced by higher cohabitation rates.
Figure A.2
Regression Coefficients for Being in First-Wave of Same-Sex Partnership/Marriage
Regression Coefficients for Being in First-Wave of Same-Sex Partnership/Marriage
Qualitative Comparisons
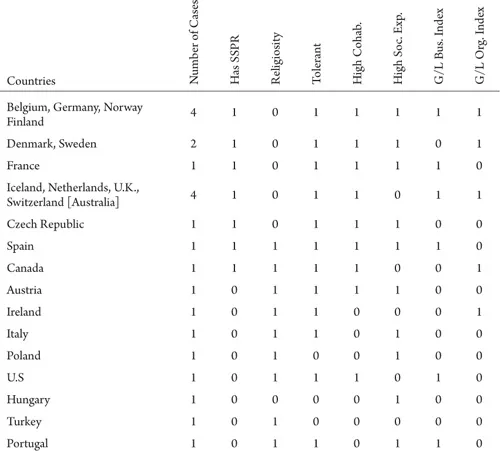
Qualitative Comparative Analysis (QCA) takes a set of dichotomous qualitative features of countries, including both outcomes and causal factors, and uses Boolean logic to identify more parsimonious sets of factors that characterize all countries with SSPRs. The first step is to characterize the possible causal factors and to assign values to those factors for each country. Here I used the quantitative values of the independent variables discussed earlier to define the presence or absence of a characteristic. For each variable, I calculated the mean for all countries. Countries whose values were above the 1990 variable mean were assigned a value of one; those below the mean got a value of zero. For instance, for all countries, the average percentage of inhabitants who reported that they would not like to have a homosexual neighbor was 36.5 in 1990.6 Countries below that average were coded as one for tolerant; countries above the average received a zero. Figures A.4 and A.5, “Boolean truth tables,” show the main variables and their codes for the twenty-three countries with sufficient data.7 Countries in brackets have the same variable values but do not have an SSPR law.
Figure A.3
Regression Coefficients for Being in First or Second Waves of Same-Sex Partnership/Marriage
Regression Coefficients for Being in First or Second Waves of Same-Sex Partnership/Marriage
First I considered a set of the basic variables from all of the theory categories. For comparison with the regressions, the baseline model considers cohabitation, tolerance of homosexuality, state social expenditures, religiosity, gay business visibility, and gay organizational density. Those six variables define 64 (26) possible combinations of factors. As can be seen in the truth table in Figure A.4, I analyzed countries that represent 13 different combinations for the first wave; Figure A.5 presents 15 actual combinations for the second wave.
Figure A.4
Truth Table of Combinations of Variables—Wave 1
Truth Table of Combinations of Variables—Wave 1
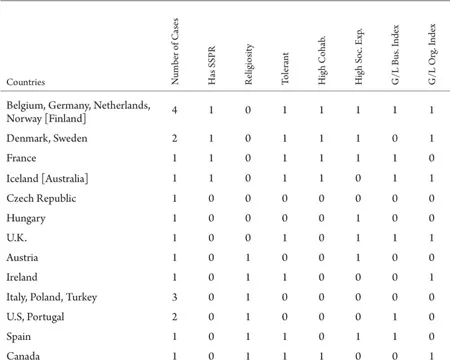
The next step is to minimize the truth table to reduce the conditions describing the countries with an SSPR to the smallest combinations that are logically possible. Ragin describes the simple rule for reducing the conditions: “[C]ombine rows that differ on only one causal condition but produce the same outcome.” In Figure A.4, for example, the first two lines of the truth table differ only in that the first line has a 1 value for a high G/L Business Index value, but the second has a 0 value. Therefore, one combination of the five other characteristics is sufficient to describe those seven countries more simply that the two separate combinations of six characteristics: low religiosity, high tolerance, high cohabitation, high social expenditure, and a high G/L organization index. In this initial step of the reduction process, the G/L Business Index value does not aid in describing countries with SSPR laws, since countries with those five characteristics have an SSPR law regardless of the G/L Business Index value. The main chapter text describes the findings in more detail.
Figure A.5
Truth Table of Combinations of Variables—Wave 1 & 2
Truth Table of Combinations of Variables—Wave 1 & 2
Appendix 2
Methods in the Dutch Couples Study
To understand the decisions and experiences of Dutch same-sex couples, I collected qualitative data from interviews with same-sex couples in the Netherlands in the first half of 2004. I interviewed one or both members of six male couples and thirteen female couples for sixty to ninety minutes about their decision to marry, to register, or to remain legally single. I interviewed a total of thirty-four people out of the thirty-eight included in the nineteen couples.
The sample came mainly from the social networks and email networks of Dutch friends and colleagues, along with some couples from the friendship networks of interviewees (a snowball sampling method). I asked colleagues in the Netherlands to circulate by e-mail the following announcement seeking participants in the study:
I am looking for people in same-sex couples who are willing to be interviewed for a research study. My main question is this: How and why did you decide whether to get married or to register as partners—or to remain unmarried and unregistered?
All answers will be confidential. The interview would last from one hour to 90 minutes. I can conduct the interview at your convenience, either in your home or my office at the University of Amsterdam. The interview would be in English.
About the researcher: I am an economist and profess...
Table of contents
- Cover Page
- Title Page
- Copyright Page
- Dedication
- Contents
- Acknowledgments
- Introduction
- Why Marry? The Value of Marriage
- Forsaking All Other Options
- The Impact of Gay Marriage on Heterosexuals
- Something Borrowed
- Something New
- Marriage Dissent in the Gay Community
- The Pace of Change
- Conclusion
- Appendix 1
- Appendix 2
- Notes
- Index
- About the Author
Frequently asked questions
Yes, you can cancel anytime from the Subscription tab in your account settings on the Perlego website. Your subscription will stay active until the end of your current billing period. Learn how to cancel your subscription
No, books cannot be downloaded as external files, such as PDFs, for use outside of Perlego. However, you can download books within the Perlego app for offline reading on mobile or tablet. Learn how to download books offline
Perlego offers two plans: Essential and Complete
- Essential is ideal for learners and professionals who enjoy exploring a wide range of subjects. Access the Essential Library with 800,000+ trusted titles and best-sellers across business, personal growth, and the humanities. Includes unlimited reading time and Standard Read Aloud voice.
- Complete: Perfect for advanced learners and researchers needing full, unrestricted access. Unlock 1.5M+ books across hundreds of subjects, including academic and specialized titles. The Complete Plan also includes advanced features like Premium Read Aloud and Research Assistant.
We are an online textbook subscription service, where you can get access to an entire online library for less than the price of a single book per month. With over 1.5 million books across 990+ topics, we’ve got you covered! Learn about our mission
Look out for the read-aloud symbol on your next book to see if you can listen to it. The read-aloud tool reads text aloud for you, highlighting the text as it is being read. You can pause it, speed it up and slow it down. Learn more about Read Aloud
Yes! You can use the Perlego app on both iOS and Android devices to read anytime, anywhere — even offline. Perfect for commutes or when you’re on the go.
Please note we cannot support devices running on iOS 13 and Android 7 or earlier. Learn more about using the app
Please note we cannot support devices running on iOS 13 and Android 7 or earlier. Learn more about using the app
Yes, you can access When Gay People Get Married by M. V. Lee Badgett in PDF and/or ePUB format, as well as other popular books in Social Sciences & Gender Studies. We have over 1.5 million books available in our catalogue for you to explore.