In the fall of 2008, the United States was plunged into a financial crisis more severe than any since the Great Depression. As banks collapsed and the state scrambled to organize one of the largest transfers of wealth in history, many—including economists and financial experts—were shocked by the speed at which events unfolded.
In this new book, John Bellamy Foster and Fred Magdoff offer a bold analysis of the financial meltdown, how it developed, and the implications for the future. They examine the specifics of the housing bubble and the credit crunch as well as situate current events within a broader crisis of monopoly-finance capitalism—one that has been gestating for several decades. It is the "real" productive economy's tendency toward stagnation, they argue, that creates a need for capital to find ways to profitably invest its surplus. But rather than invest in socially useful projects that would benefit the vast majority, capital has constructed a financialized "casino" economy that neglects social needs and, as has become increasingly clear, is fatally unstable. Written over a two-year period immediately prior to the onset of the crisis, this timely and illuminating book is necessary reading for all those who wish to understand the current situation, how we got here, and where we are heading.
- 144 pages
- English
- ePUB (mobile friendly)
- Available on iOS & Android
eBook - ePub
About this book
Trusted by 375,005 students
Access to over 1.5 million titles for a fair monthly price.
Study more efficiently using our study tools.
Information
PART ONE
Causes
1. The Household Debt Bubble
May 2006
It is an inescapable truth of the capitalist economy that the uneven, class-based distribution of income is a determining factor of consumption and investment. How much is spent on consumption goods depends on the income of the working class. Workers necessarily spend all or almost all of their income on consumption. Thus for households in the bottom 60 percent of the income distribution in the United States, average personal consumption expenditures equaled or exceeded average pre-tax income in 2003; while the fifth of the population just above them used up five-sixths of their pre-tax income (most of the rest no doubt taken up by taxes) on consumption.1 In contrast, those high up on the income pyramid—the capitalist class and their relatively well-to-do hangers-on—spend a much smaller percentage of their income on personal consumption. The overwhelming proportion of the income of capitalists (which at this level has to be extended to include unrealized capital gains) is devoted to investment.
It follows that increasing inequality in income and wealth can be expected to create the age-old conundrum of capitalism: an accumulation (savings-and-investment) process that depends on keeping wages down while ultimately relying on wage-based consumption to support economic growth and investment. It is impossible to do as suggested by the early-twentieth-century U.S. economist J. B. Clark—to “build more mills that should make more mills for ever”—in the absence of sufficient consumer demand for the products created by these mills.2
Under these circumstances, in which consumption and ultimately investment are heavily dependent on the spending of those at the bottom of the income stream, one would naturally suppose that a stagnation or decline in real wages would generate crisis-tendencies for the economy by constraining overall consumption expenditures. There is no doubt about the growing squeeze on wage-based incomes. Except for a small rise in the late 1990s, real wages have been sluggish for decades. The typical (median-income) family has sought to compensate for this by increasing its number of jobs and working hours per household. Nevertheless, the real (inflation-adjusted) income of the typical household fell for five years in a row through 2004. The bottom 95 percent of income recipients experienced decreasing real average household income in 2003–04 (with the top 5 percent, however, making sharp gains). In 2005 real wages fell by 0.8 percent.3
Yet, rather than declining as a result, overall consumption has continued to climb. Indeed, U.S. economic growth is ever more dependent on what appears at first glance to be unstoppable increases in consumption. Between 1994 and 2004 consumption grew faster than national income, with the share of personal consumption expenditures in GDP rising from 67 to 70 percent.4 How is this paradox—declining real wages and soaring consumption—to be explained?
Commenting on this same problem in May 2000 (near the end of the previous business cycle expansion) the Monthly Review editors asked:
But if this [stagnating wages] is the case, where is all of the consumption coming from? Has capital managed somehow to square the circle—to increase consumption rapidly while simultaneously holding down wages? The obvious answer—or a good part of it—is that in a period of stagnant wages, working people are increasingly living beyond their means by borrowing in order to make ends meet (or, in some cases, in a desperate attempt to inch up their living standards). To a considerable extent, the current economic expansion has been bought on consumer debt.
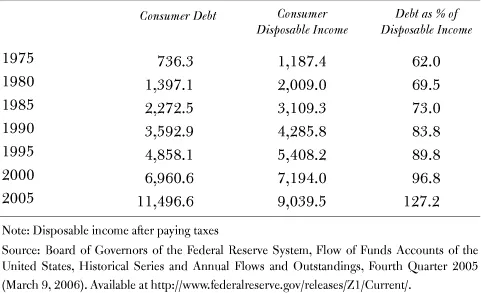
If this was the case six years ago just before the last economic downturn, it is even more so today and the potential consequences are worse. Since consumption expenditures have been rising in the United States much faster than income the result has been a rise in the ratio of overall consumer debt to disposable income. As shown in Table 1.1, the ratio of outstanding consumer debt to consumer disposable income has more than doubled over the last three decades from 62 percent in 1975 to 127 percent in 2005. This is partly made possible by historically low interest rates, which have made it easier to service the debt in recent years (although interest rates are now rising). Hence, a better indication of the actual financial impact of the debt on households is provided by the debt service ratio—consumer debt service payments to consumer disposable income. Chart 1.1 shows the rapid increase in the debt service ratio during the quarter-century from 1980 to the present, with a sharp upturn beginning in the mid-1990s and continuing with only slight interruptions ever since.
TABLE 1.1: Outstanding Consumer Debt as a Percentage of Disposable Income (in billions of dollars)
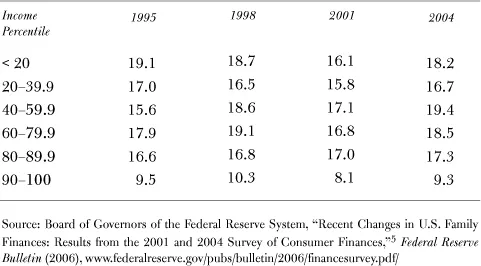
Aggregate data of this kind, however, does not tell us much about the impact of such debt on various income groups (classes). For information on that it is necessary to turn to the Federal Reserve Board’s Survey of Consumer Finances, which is carried out every three years. Table 1.2 provides data on what is known as the “family debt burden” (debt service payments as a percentage of disposable income) by income percentiles. Although the family debt burden fell for almost all levels of income during the most recent recession (marked by the 2001 survey) it has risen sharply during the latest sluggish expansion. For those families in the median-income percentiles (40.0–59.9), debt burdens have now reached their peak levels for the entire period 1995–2004. These families have seen their debt service payments as a percentage of disposable income increase by about 4 percentage points since 1995, to almost 20 percent—higher than any other income group. The lowest debt burden is naturally to be found in those in the highest (90–100) income percentiles, where it drops to less than 10 percent of disposable income.
CHART 1.1: Consumer Debt Service Ratio (Debt Service Payments to Disposable Income)
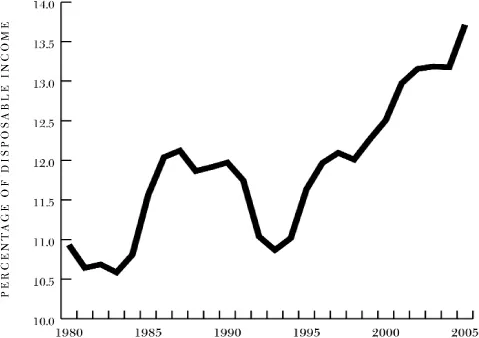
Source: Board of Governors, Federal Reserve Board, Household Debt Service and Financial Obligations Ratios, www.federalreserve.gov/releases/housedebt/
Note: The debt service ratios provided in the Federal Reserve’s Household Debt Service and Financial Obligations Ratios data (used in this chart) and in the Survey of Consumer Finances (used in the following tables) are not directly comparable. The data here is based on aggregate consumer debt service to aggregate consumer disposable income and not on survey data as in the tables that follow.
TABLE 1.2: Family Debt Burden. Debt Service Payments as a Percentage of Family Income
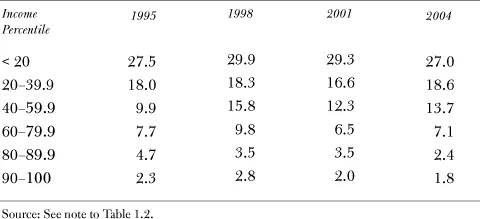
All of this points to the class nature of the distribution of household debt. This is even more obvious when one looks at those indebted families who carry exceptionally high debt burdens and those that are more than sixty days past due in their debt service payments. Table 1.3 shows the percentage of indebted families by income percentiles that have family debt burdens above 40 percent. Such financial distress is inversely correlated with income. More than a quarter of the poorest indebted families—those in the lowest fifth of all families—are carrying such heavy debt burdens. The next two-fifths above that, i.e., the 20.0–59.9 income percentiles, have experienced increases in the percentage of indebted families carrying such excessive debt burdens since 1995—with the number of indebted families caught in this debt trap rising to around 19 percent in the second lowest quintile, and to around 14 percent even in the middle quintile. In contrast, for those in the 40 percent of families with the highest incomes, the percentage of households experiencing such financial distress has diminished since 1995. Thus with the rapid rise in outstanding debt to disposable income, financial distress is ever more solidly based in lower-income, working-class families.
TABLE 1.3: Percentage of Indebted Families Whose Debt Service Payments are Above 40 Percent of Family Income
Soaring family debt burdens naturally pave the way to defaults and bankruptcies. Personal bankruptcies during the first G. W. Bush administration totaled nearly five million, a record for any single term in the White House. Due to the harsh bankruptcy legislation passed by Congress in 2005 the number of bankruptcies has recently declined—at least in the short term. But by making it more difficult for families to free themselves from extreme debt burdens, this is certain to produce ever greater numbers of workers who are essentially “modern-day indentured servants.”6
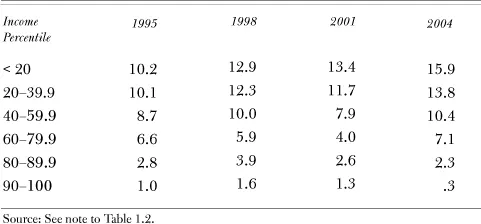
Table 1.4 shows the percentage of indebted families in each income category that are sixty days or more past due on any debt service payment. For families below the 80th percentile in income the percentage of indebted families falling into this category has grown sharply since 1995. In contrast, families in the 80th percentile and above have seen a drop in the percentage of indebted families that are overdue on a debt payment. Again, we see that the growth of financial distress in the United States today is centered on working-class households.
The biggest portion of debt is secured by primary residence, the main asset of the vast majority of families. Debt secured by homes has continued to soar. Between 1998 and 2001 the median amount of home-secured debt rose 3.8 percent; while from 2001–04 it rose a phenomenal 27.3 percent! Around 45 percent of homeowners with a first-lien mortgage refinanced their homes in 2001–04 (as compared with 21 percent in the previous three years), with more than a third of these borrowing money beyond the amount refinanced. The median amount of the additional equity extracted by such borrowers was $20,000.7 Despite skyrocketing house prices in recent years the ratio of homeowners’ equity/value of household real estate has continued to decrease from 68 percent in 1980–89, to 59 percent in 1990–99, to 57 percent in 2000–05.8
TABLE 1.4: Percentage of Indebted Families Whose Debt Service Payments Are Sixty Days or More Past Due on Any Debt Service Payment
As house prices have soared more risky forms of mortgage lending have emerged. Left Business Observer editor Doug Henwood noted in The Nation,
Time was, you had to come up with a hefty down payment to buy a house. No longer: In 2005 the median first-time buyer put down only 2 percent of the sales price, and 43 percent made no down payment at all. And almost a third of new mortgages in 2004 and ’05 were at adjustable rates (because the initial payments are lower than on fixed-rate loans). At earlier peaks interest rates were near cyclical highs, but the past few years have seen the lowest interest rates in a generation. So adjustable mortgages are likely to adjust only one way: up.9
The typical family is also mired in credit card debt. At present nearly two-thirds of all cardholders carry balances and pay finance fees each month—with the average debt balance per cardholder rising to $4,956 at the end of 2005. In recent years, there has been a shift from fixed to variable rate cards, as interest rates have begun to rise, with about two-thirds of all credit cards now carrying variable rates—up from a little more than half a year ago. Interest rates on cards are rising rapidly—what the Wall Street Journal has called “The Credit-Card Catapult.” In February 2006 the average interest rate for variable-rate cards jumped to 15.8 percent from 12.8 percent for all of 2005. Meanwhile, the portion of credit card-issuer profits represented by fees went up from 28 percent in 2000 to an estimated 39 percent in 2004. Altogether, unpaid credit card balances at the end of 2005 amounted to a total of $838 billion.10 The effects of this fall most heavily on working-class and middle-income families. According to the Survey of Consumer Finances, the percentage of households carrying credit card balances rises with income up until the 90th income percentile, and then drops precipitously.
Another realm of increased borrowing is installment borrowing, encompassing loans that have fixed payments and fixed terms such as automobile loans and student loans—constituting the two biggest areas of installment borrowing. In 2001–04 the average amount owed on such loans grew by 18.2 percent.11
Low-income families are more and more subject to predatory lending: payday loans, car title loans, subprime mortgage lending, etc.—all of which are growing rapidly in the current climate of financial distress. According to the Center for Responsible Lending,
A typical car title loan has a triple-digit annual interest rate, requires repayment within one month, and is made for much less than the value of the car…. Because the loans are structured to be repaid as a single balloon payment after a very short term, borrowers frequently cannot pay the full amount due on the maturity date and instead find themselves extending or “rolling over” the loan repeatedly. In this way, many borrowers pay fees well in excess of the amount they originally borrowed. If the borrower fails to keep up with these recurring payments, the lender may summarily repossess the car.12
The growing financial distress of households has led to the rise of an army of debt collectors, with the number of companies specializing in buying and collecting unpaid debts rising from around 12 in 1996 to more than 500 by 2005. According to the Washington Post, this has led to: “Embarrassing calls at work. Threats of jail and even violence. Improper withdrawals from bank accounts. An increasing number of consumers are complaining of abusive techniques from companies that are a new breed of debt collectors.”13
In this general context of rising household debt, it is of course the rapid increase in home-secured borrowing that is of the greatest macroeconomic significance, and that has allowed this system of debt expansion to balloon so rapidly. Homeowners are increasingly withdrawing equity from their homes to meet their spending needs and pay off credit card balances. As a result, “in the October to December [2005] period, the volume of new net home mortgage borrowing rose by $1.11 trillion, bringing the level of outstanding mortgage debt to $8.66 trillion—an amount that equaled 69.4 percent of U.S. GDP.”14 The fact that this is happening at a time of growing inequality of income and wealth and stagnant or declining real wages and real income for most people leaves little doubt that it is driven to a considerable extent by need as families try to maintain their living standards.
The housing bubble, associated with rising house prices and the attendant increases in home refinancing and spending, which has been developing for decades, was a major factor in allowing the economy to recover from the 2000 stock market meltdown and the recession in the following year. Only two years after the stock market decline, the iconoclastic economist and financial analyst Stephanie Pomboy of MacroMavens was writing of “The Great Bubble Transfer,” in which the continuing expansion of the housing bubble was miraculously compensating for the decline in the stock market bubble by spurring growth in its stead. Yet, “like the bubble in financial assets,” Pomboy wrote,
The new real estate bubble has its own distinctly disturbing characteristics. For example one could argue, and quite cogently, that the home has become the new “margin account” as consumers through popular programs like “cash-out” Refi[nancing] increasingly leverage against unrealized gains in their single largest asset. Perhaps the most disturbing hallmark of this Refi mania is the corresponding plunge in homeowners’ equity-stake.… The cash-out Refi numbers reveal a “speculative fervor” that makes the Nasdaq mania look tame. According to estimates by Fannie Mae, the average cash-out Refi is $34,000. This sounds like a lot to me, particularly considering that the median home price is just $150,000 … e.g., the average Joe is extracting 20% of his ho...
Table of contents
- Cover Page
- Title Page
- Copyright Page
- Contents
- Preface
- Introduction
- Part One: Causes
- Part Two: Consequences
- Notes
- Index
Frequently asked questions
Yes, you can cancel anytime from the Subscription tab in your account settings on the Perlego website. Your subscription will stay active until the end of your current billing period. Learn how to cancel your subscription
No, books cannot be downloaded as external files, such as PDFs, for use outside of Perlego. However, you can download books within the Perlego app for offline reading on mobile or tablet. Learn how to download books offline
Perlego offers two plans: Essential and Complete
- Essential is ideal for learners and professionals who enjoy exploring a wide range of subjects. Access the Essential Library with 800,000+ trusted titles and best-sellers across business, personal growth, and the humanities. Includes unlimited reading time and Standard Read Aloud voice.
- Complete: Perfect for advanced learners and researchers needing full, unrestricted access. Unlock 1.5M+ books across hundreds of subjects, including academic and specialized titles. The Complete Plan also includes advanced features like Premium Read Aloud and Research Assistant.
We are an online textbook subscription service, where you can get access to an entire online library for less than the price of a single book per month. With over 1.5 million books across 990+ topics, we’ve got you covered! Learn about our mission
Look out for the read-aloud symbol on your next book to see if you can listen to it. The read-aloud tool reads text aloud for you, highlighting the text as it is being read. You can pause it, speed it up and slow it down. Learn more about Read Aloud
Yes! You can use the Perlego app on both iOS and Android devices to read anytime, anywhere — even offline. Perfect for commutes or when you’re on the go.
Please note we cannot support devices running on iOS 13 and Android 7 or earlier. Learn more about using the app
Please note we cannot support devices running on iOS 13 and Android 7 or earlier. Learn more about using the app
Yes, you can access The Great Financial Crisis by John Bellamy Foster,Fred Magdoff in PDF and/or ePUB format, as well as other popular books in Economics & Economic Theory. We have over 1.5 million books available in our catalogue for you to explore.