![]()
PART
1
Understanding Financial Information
![]()
CHAPTER ONE
The Balance Sheet
The balance sheet is a representation of the company’s financial health. It is presented at a specific point in time, usually the end of the fiscal (accounting) period, which could be a year, a quarter, or a month. It lists the assets that the company owns and the liabilities that the company owes to others; the difference between the two represents the ownership position (stockholders’ equity).
More specifically, the balance sheet tells us about the company’s:
- Liquidity. The company’s ability to meet its current obligations.
- Financial health. The company’s ability to meet its obligations over the longer term; this concept is similar to liquidity, except that it takes a long-term perspective and also incorporates strategic issues.
Financial strength reflects the company’s ability to:
- Secure adequate resources to finance its future.
- Maintain and expand efficient operations.
- Properly support marketing efforts.
- Use technology for profitable advantage.
- Compete successfully.
The balance sheet also helps us to measure the company’s operating performance. This includes the amount of profits and cash flow generated relative to:
- Owners’ investment (stockholders’ equity)
- Total resources available (assets)
- Amount of business generated (revenue)
Analyzing the data in the balance sheet helps us to evaluate the company’s asset management performance. This includes the management of:
- Inventory, measured with an inventory turnover ratio
- Customer credit, measured using an accounts receivable measure known as days’ sales outstanding or collection period
- Total asset turnover, which reflects capital intensity
- Degree of vertical integration, which reflects management efficiency and management of the supply chain
Mathematical formulas called ratios are very valuable in the analytical process. They should be used to compare the company’s performance against:
- Its standards of performance (budget)
- Its past history (trends)
- The performance of other companies in a similar business (benchmarking)
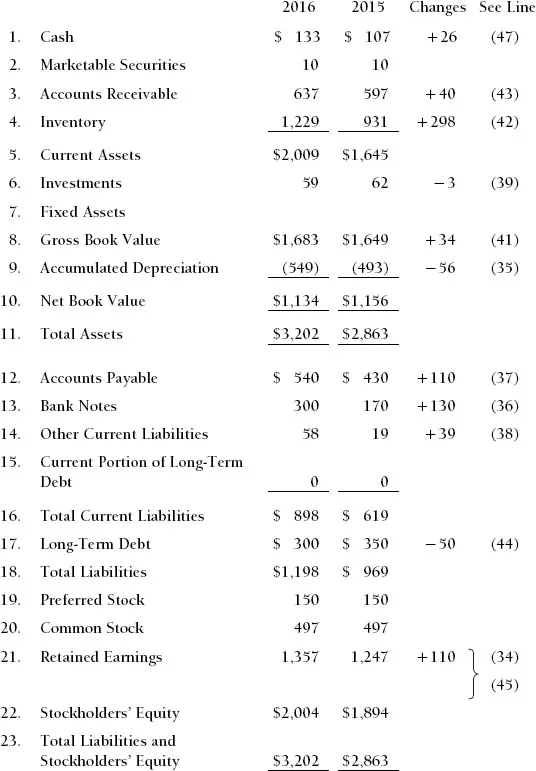
Look at the balance sheet of the Metropolitan Manufacturing Company, shown in Exhibit 1-1, dated December 31, 2016. Notice that it also gives comparable figures for December 31, 2015. Providing the same information for the prior year is called a reference point. This is essential for understanding and analyzing the information and should always be provided. The third column describes the differences in the dollar amounts between the two years. This information summarizes cash flow changes that have occurred between December 31, 2015, and December 31, 2016. This very critical information is presented more explicitly in a report called the sources and uses of funds statement or the statement of cash flows, which is described more fully in Chapter 3. (The numbers in parentheses in the fourth column refer to the line items in Exhibit 3-1, The Sources and Uses of Funds Statement, which we discuss in Chapter 3.)
Expenses and Expenditures
Before we look at the balance sheet in detail, we need to understand the difference between the concepts of expenses and expenditures. Understanding this difference will provide valuable insights into accounting practices.
An expenditure is the disbursement of cash or a commitment to disburse cash—hence the phrase capital expenditure. An expense is the recognition of the expenditure and its recording for accounting purposes in the time period(s) that benefited from it (i.e., the period in which it helped the company achieve revenue).
The GAAP concept that governs this is called the matching principle: Expenses should be matched to benefits, which means that they should be recorded in the period of time that benefited from the expenditure rather than the period of time in which the expenditure occurred.
The accounting concepts that reflect this principle include the following:
- Depreciation
- Amortization
- Accruals
Exhibit 1-1. Metropolitan Manufacturing Company, Inc.
Comparative Balance Sheets December 31, 2016 and 2015 ($000)
- Reserves
- Prepaid Expenses
Let’s review one example. Suppose a company buys equipment (makes a capital expenditure) for $100,000. The company expects the equipment to last (provide benefits) for five years. This is called the equipment’s estimated useful life. Using the basic concept called straight-line depreciation (to be discussed later in this chapter), the depreciation expense recorded each year will be:
Each year there will be an expense of $20,000 on the company’s income statement. Clearly, no such cash expenditures of $20,000 were made during any of those years, only the initial $100,000.
Assets
The assets section of the balance sheet is a financial representation of what the company owns. The items are presented at the lower of their purchase price or their market value at the time of the financial statement presentation (see the discussion of GAAP in Chapter 4).
Assets are listed in the sequence of their liquidity, that is, the sequence in which they are expected to be converted to cash.
1. Cash, $133,000
Cash is the ultimate measure of an organization’s short-term purchasing power, its ability to pay its debts and to expand and modernize its operations. It represents immediately available purchasing power. This balance sheet category primarily consists of funds in checking accounts in commercial banks. This money may or may not earn interest for the company. Its primary characteristic is that it is immediately liquid; it is available to the firm now. This account may also be called Cash and Cash Equivalents or Cash and Marketable Securities. Cash equivalents are securities with very short maturities, perhaps up to three months, that can earn some interest income for the company.
2. Marketable Securities, $10,000
This category includes the short-term investments that companies make when they have cash that will not be needed within the next few weeks or months. As a result of intelligent cash planning, the company has the opportunity to earn extra profit in the form of interest income from these securities. Some companies earn sizable returns from these investments, particularly when interest rates are high.
The securities that can be placed in this category include certificates of deposit (CDs), Treasury bills, and commercial paper. All have very short maturities, usually 90 to 180 days. CDs are issued by commercial banks. Treasury bills are issued by the U.S. government, and commercial paper is issued by very large, high-quality industrial corporations.
Purchasing these high-quality securities, which generally have little or no risk (with the exception of recent history, when regulatory oversight was deficient), gives a company the opportunity to earn interest on money that it does not need immediately.
3. Accounts Receivable, $637,000
When a company sells products to customers, it may receive immediate payment. This may be done through a bank draft, a check, a credit card, a letter of credit, a wire transfer, or, in the case of a supermarket or retail store, cash. On the other hand, as part of the selling process, the customer may be given the opportunity to postpone paying for the products or services until a specified future date. This is referred to as giving the customer credit. Accounts receivable is the accounting term that describes the value of products delivered or services provided to customers for which the customers have not yet paid. The typical time period that companies wait to receive these funds is 30 to 60 days.
In order to have accounts receivable, the company needs to have earned revenue. Revenue is the amount of money that the company has earned by providing products and services to its customers. Sometimes cash is received before revenue is earned, as when a customer makes a down payment. Retail stores usually receive their cash when they earn the revenue. For credit card sales, including PayPal and Apple iPay, this is usually the next day. Most other corporations receive their cash after they earn their revenue, resulting in accounts receivable.
A further word about revenue. It is not uncommon in certain businesses for the company to receive some advanced payment. As we just mentioned, there might be a down payment when an order is placed. And there are even circumstances when the company receives all of the cash before it actually earns the revenue.
When a company designs customized products for sale to one specific customer, for example, it may require payment in full before production actually begins. It may be hiring people specific to the job, buying materials not useful anywhere else, and making a product not sellable to any other customer, especially if the design is owned by the customer placing the order. The financial risk of the customer paying slowly or maybe not at all might be too great.
When a company licenses software for a three-year period, it may be required to pay for the three-year license in advance. Technically we do not buy software; we buy the privilege of using it for a specified period of time in the form of a license.The practice of paying in advance is quite common when hiring consulting firms for major long-term projects. Payments might be made monthly, in advance of the project’s progress.
When a company receives funds in advance of the work done, this cash appears on the balance sheet as an asset called “deferred revenue.” There will be a commensurate liability on the balance sheet to represent the work that the company “owes” to the customer. On day one of the project, these asset and liability amounts will be the same. If Metropolitan Manufacturing Company had received advanced customer payments (which it has not), the deferred revenue would appear as a current asset on the balance sheet, and as a long-term asset if the arrangement is expected to last more than one year.
4. Inventory, $1,229,000
This represents the financial investment that the company has made in the manufacture or production (or, in the case of a retail store, the purchase) of products that will be sold to customers. For manufactured goods, this amount is presented in three categories: finished goods, work in process, and raw materials.
Finished Goods. These are fully completed products that are ready for shipment to customers. The amounts shown on the balance sheet include the cost of purchased raw materials and components used in the products, the labor that assembled the products at each stage of their value-adding manufacture (called direct labor), and all of the support expenditures (called manufacturing overhead) that also helped to add value to the products. Products in this category are owned by the company, and thus are presented as assets. They will remain so until they are delivered to a customer’s premises or the customer’s distribution network (vehicles or warehouse) and the customer has agreed to take financial responsibility for them (the customer buys them).
Work in Process. Inventory in this category has had some value added by the company—it is more than raw materials and components, but it is not yet something that can be delivered to the customer. If the item has been the subject of any activity by the production line, but is not yet ready for final customer acceptance, it is considered work in process.
Raw Materials. Raw materials are products or components that have been received from vendors or suppliers and to which the company has done nothing except receive them and store them in a warehouse. Since the company has not yet put the raw materials into production, no value has yet been added. The amount presented in this category may include the cost of bringing the product from the vendor to the company’s warehouse, whether this freight cost is paid separately, itemized in the vendor’s invoice, or just included in the purchase price.
5. Current Assets, $2,009,000
This is t...