This book combines practical guidance and theoretical background for analysts using empirical techniques in competition and antitrust investigations. Peter Davis and Eliana Garcés show how to integrate empirical methods, economic theory, and broad evidence about industry in order to provide high-quality, robust empirical work that is tailored to the nature and quality of data available and that can withstand expert and judicial scrutiny. Davis and Garcés describe the toolbox of empirical techniques currently available, explain how to establish the weight of pieces of empirical work, and make some new theoretical contributions.
The book consistently evaluates empirical techniques in light of the challenge faced by competition analysts and academics--to provide evidence that can stand up to the review of experts and judges. The book's integrated approach will help analysts clarify the assumptions underlying pieces of empirical work, evaluate those assumptions in light of industry knowledge, and guide future work aimed at understanding whether the assumptions are valid. Throughout, Davis and Garcés work to expand the common ground between practitioners and academics.
Trusted by 375,005 students
Access to over 1.5 million titles for a fair monthly price.
A solid knowledge of both econometric and economic theory is crucial when designing and implementing empirical work in economics. Econometric theory provides a framework for evaluating whether data can distinguish between hypotheses of interest. Economic theory provides guidance and discipline in empirical investigations. In this chapter, we first review the basic principles underlying the analysis of demand, supply, and pricing functions, as well as the concept and application of Nash equilibrium. We then review elementary oligopoly theory, which is the foundation of many of the empirical strategies discussed in this book. Continuing to develop the foundations for high-quality empirical work, in chapter 2 we review the important elements of econometrics for investigations. Following these first two review chapters, chapters 3–10 develop the core of the material in the book. The concepts reviewed in these first two introductory chapters will be familiar to all competition economists, but it is worthwhile reviewing them since understanding these key elements of economic analysis is crucial for an appropriate use of quantitative techniques.
1.1 Demand Functions and Demand Elasticities
The analysis of demand is probably the single most important component of most empirical exercises in antitrust investigations. It is impossible to quantify the likelihood or the effect of a change in firm behavior if we do not have information about the potential response of its customers. Although every economist is familiar with the shape and meaning of the demand function, we will take the time to briefly review the derivation of the demand and its main properties since basic conceptual errors in its handling are not uncommon in practice. In subsequent chapters we will see that demand functions are critical for many results in empirical work undertaken in the competition arena.
1.1.1 Demand Functions
We begin this chapter by reviewing the basic characteristics of individual demand and the derivation of aggregate demand functions.
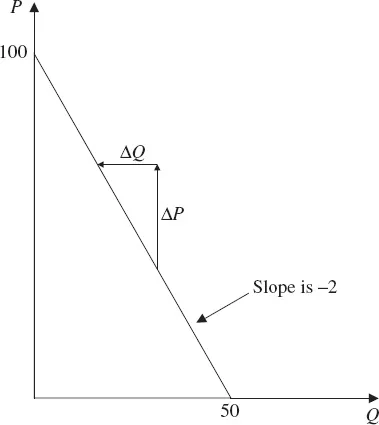
Figure 1.1. (Inverse) demand function.
1.1.1.1 The Anatomy of a Demand Function
An individual’s demand function describes the amount of a good that a consumer would buy as a function of variables that are thought to affect this decision such as price Pi and often income y. Figure 1.1 presents an example of an individual linear demand function for a homogeneous product: Qi = 50 − 0.5Pi or rather for the inverse demand function, Pi = 100 − 2Qi. More generally, we may write Qi = D(Pi, y).1 Inverting the demand curve to express price as a function of quantity demanded and other variables yields the “inverse demand curve” Pi = P(Qi, y). Standard graphs of an individual’s demand curve plot the quantity demanded of the good at each level of its own price and take as a given the level of income and the level of the prices of products that could be substitutes or complements. This means that along a given plotted demand curve, those variables are fixed. The slope of the demand curve therefore indicates at any particular point by how much a consumer would reduce (increase) the quantity purchased if the price increased (decreased) while income and any other demand drivers stayed fixed.
In the example in figure 1.1, an increase in price, ΔP, of
10 will decrease the demand for the product by 5 units shown as ΔQ. The consumer will not purchase any units if the price is above 100 because at that point the price is higher than the value that the customer assigns to the first unit of the good.
One interpretation of the inverse demand curve is that it shows the maximum price that a consumer is willing to pay if she wants to buy Qi units of the good. While a consumer may value the first unit of the good highly, her valuation of, say, the one hundredth unit will typically be lower and it is this diminishing marginal valuation which ensures that demand curves typically slope downward. If our consumer buys a unit only if her marginal valuation is greater than the price she must pay, then the inverse demand curve describes our consumer’s marginal valuation curve.
Given this interpretation, the inverse demand curve describes the difference between the customer’s valuation of each unit and the actual price paid for each unit. We call the difference between what the consumer is willing to pay for each unit and what he or she actually pays the consumer’s surplus available from that unit. For concreteness, I might be willing to pay a maximum of
10 for an umbrella if it’s raining, but may nonetheless only have to pay
5 for it, leaving me with a measure of my benefit from buying the umbrella and avoiding getting wet, a surplus of
5. At any price Pi, we can add up the consumer surplus available on all of the units consumed (those with marginal valuations above Pi) and doing so provides an estimate of the total consumer surplus if the price is Pi.
In a market with homogeneous products, all products are identical and perfectly substitutable. In theory this results in all products having the same price, which is the only price that determines the demand. In a market with differentiated products, products are not perfectly substitutable and prices will vary across products sold in the market. In those markets, the demand for any given product is determined by its price and the prices of potential substitutes. In practice, markets which look homogeneous from a distance will in fact be differentiated to at least some degree when examined closely. Homogeneity may nonetheless be a reasonable modeling approximation in many such situations.
1.1.1.2 The Contribution of Consumer Theory: Deriving Demand
Demand functions are classically derived by using the behavioral assumption that consumers make choices in a way that can be modeled as though they have an objective, to maximize their utility, which they do subject to the constraint that they cannot spend more than they earn. As is well-known to all students of microeconomic theory, the existence of such a utility function describing underlying preferences may in turn be established under some nontrivial conditions (see, for example, Mas-Colell et al. 1995, chapter 1). Maximizing utility is equivalent to choosing the most preferred bundle of goods that a consumer can buy given her wealth.
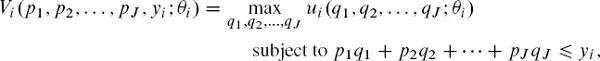
More specifically, economists have modeled a customer of type (yi, θi) as choosing to maximize her utility subject to the budget constraint that her total expenditure cannot be higher than her income:
where pj and qj are prices and quantities of good j, ui (q1, q2, qJ; θi) is the utility of individual i associated with consuming this vector of quantities, yi is the disposable income of individual i, and θi describes the individual’s preference type. In many empirical models using this fram...
Table of contents
Cover
Half Title
Title
Copyright
Dedication
Contents
Preface
Acknowledgments
1 The Determinants of Market Outcomes
2 Econometrics Review
3 Estimation of Cost Functions
4 Market Definition
5 The Relationship between Market Structure and Price
6 Identification of Conduct
7 Damage Estimation
8 Merger Simulation
9 Demand System Estimation
10 Quantitative Assessment of Vertical Restraints and Integration
Conclusion
References
Index
Frequently asked questions
Yes, you can cancel anytime from the Subscription tab in your account settings on the Perlego website. Your subscription will stay active until the end of your current billing period. Learn how to cancel your subscription
No, books cannot be downloaded as external files, such as PDFs, for use outside of Perlego. However, you can download books within the Perlego app for offline reading on mobile or tablet. Learn how to download books offline
Perlego offers two plans: Essential and Complete
Essential is ideal for learners and professionals who enjoy exploring a wide range of subjects. Access the Essential Library with 800,000+ trusted titles and best-sellers across business, personal growth, and the humanities. Includes unlimited reading time and Standard Read Aloud voice.
Complete: Perfect for advanced learners and researchers needing full, unrestricted access. Unlock 1.5M+ books across hundreds of subjects, including academic and specialized titles. The Complete Plan also includes advanced features like Premium Read Aloud and Research Assistant.
Both plans are available with monthly, semester, or annual billing cycles.
We are an online textbook subscription service, where you can get access to an entire online library for less than the price of a single book per month. With over 1.5 million books across 990+ topics, we’ve got you covered! Learn about our mission
Look out for the read-aloud symbol on your next book to see if you can listen to it. The read-aloud tool reads text aloud for you, highlighting the text as it is being read. You can pause it, speed it up and slow it down. Learn more about Read Aloud
Yes! You can use the Perlego app on both iOS and Android devices to read anytime, anywhere — even offline. Perfect for commutes or when you’re on the go. Please note we cannot support devices running on iOS 13 and Android 7 or earlier. Learn more about using the app
Yes, you can access Quantitative Techniques for Competition and Antitrust Analysis by Peter Davis,Eliana Garcés,Eliana Garces-Tolon in PDF and/or ePUB format, as well as other popular books in Economics & Economic Theory. We have over 1.5 million books available in our catalogue for you to explore.