This book shows how current and recent market prices convey information about the probability distributions that govern future prices. Moving beyond purely theoretical models, Stephen Taylor applies methods supported by empirical research of equity and foreign exchange markets to show how daily and more frequent asset prices, and the prices of option contracts, can be used to construct and assess predictions about future prices, their volatility, and their probability distributions.
Stephen Taylor provides a comprehensive introduction to the dynamic behavior of asset prices, relying on finance theory and statistical evidence. He uses stochastic processes to define mathematical models for price dynamics, but with less mathematics than in alternative texts. The key topics covered include random walk tests, trading rules, ARCH models, stochastic volatility models, high-frequency datasets, and the information that option prices imply about volatility and distributions.
Asset Price Dynamics, Volatility, and Prediction is ideal for students of economics, finance, and mathematics who are studying financial econometrics, and will enable researchers to identify and apply appropriate models and methods. It will likewise be a valuable resource for quantitative analysts, fund managers, risk managers, and investors who seek realistic expectations about future asset prices and the risks to which they are exposed.
- 544 pages
- English
- ePUB (mobile friendly)
- Available on iOS & Android
eBook - ePub
Asset Price Dynamics, Volatility, and Prediction
About this book
Trusted by 375,005 students
Access to over 1.5 million titles for a fair monthly price.
Study more efficiently using our study tools.
Information
Publisher
Princeton University PressYear
2011Print ISBN
9780691134796
9780691115375
eBook ISBN
9781400839254
1
Introduction
1.1 Asset Price Dynamics
Asset prices move as time progresses: they are dynamic. It is certainly very difficult to provide a correct prediction of future price changes. Nevertheless, we can make statements about the probability distributions that govern future prices. Asset price dynamics are statements that contain enough detail to specify the probability distributions of future prices. We seek statements that are empirically credible, that can explain the historical prices that we have already seen.
Investors and fund managers who understand the dynamic behavior of asset prices are more likely to have realistic expectations about future prices and the risks to which they are exposed. Quantitative analysts need to understand asset price dynamics, so that they can calculate competitive prices for derivative securities. Finance researchers who explore hypotheses about capital markets often need to consider the implications of price dynamics; for example, hypothesis tests about price reactions to corporate events should be made robust against changes in price volatility around these events.
Explaining how prices change is a very different task to explaining why they change. We will encounter many insights into how prices change that rely on the empirical analysis of prices. Many general explanations for price changes can be offered: relevant news about the asset and its cash flows, macroeconomic news, divergent beliefs about the interpretation of news, and changes in investor sentiment. It seems, however, to be impossible to provide specific explanations for most price changes.
1.2 Volatility
A striking feature of asset prices is that they move more rapidly during some months than during others. Prices move relatively slowly when conditions are calm, while they move faster when there is more news, uncertainty, and trading. The volatility of prices refers to the rate at which prices change. Commentators and traders define this rate in several ways, primarily by the standard deviation of the return obtained by investing in an asset. Risk managers are particularly interested in measuring and predicting volatility, as higher levels imply a higher chance of a large adverse price change.
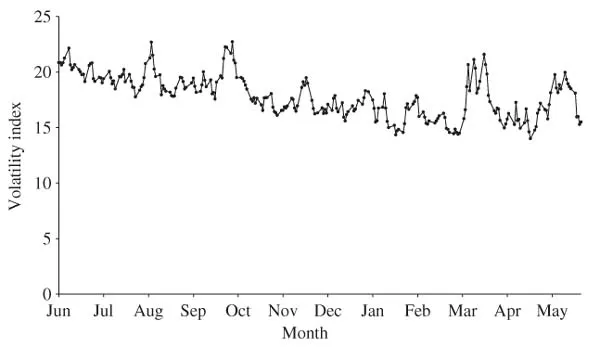
Figure 1.1. A year of S&P 500 index levels.
1.3 Prediction
Predictions concerning future prices are obtained from conditional probability distributions that depend on recent price information. Three prediction problems are addressed in this book. The first forecasting question posed by most people is, Which way will the price go, up or down? However hard we try, and as predicted by efficient market theory, it is very difficult to obtain an interesting and satisfactory answer by considering historical prices. A second question, which can be answered far more constructively, is, How volatile will prices be in the future? The rate at which prices change is itself dynamic, so that we can talk of extreme situations such as turbulent markets (high volatility) and tranquil markets (low volatility). The level of volatility can be measured and predicted, with some success, using either historical asset prices or current option prices. A third and more ambitious question is to ask for the entire probability distribution of a price several time periods into the future. This can be answered either by Monte Carlo simulation of the assumed price dynamics or by examining the prices of several option contracts.
1.4 Information
There are several sources of information that investors can consider when they assess the value of an asset. To value the shares issued by a firm, investors may be interested in expectations and measures of risk for future cash flows, interest rates, accounting information about earnings, and macroeconomic variables that provide information about the state of the economy. These specific sources of information are generally ignored in this text, because my objective is not to explain how to price assets. Relevant information is not ignored by traders, who competitively attempt to incorporate it into asset prices. Competition between traders is often assumed in finance research to be sufficient to ensure that prices very quickly reflect a fair interpretation of all relevant information.
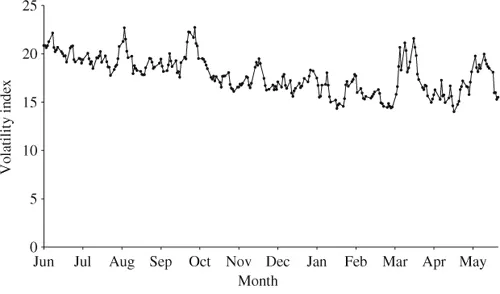
Figure 1.2. A year of VIX observations.
The prices of financial assets and their derivative securities are the information that we consider when making statements about future asset prices. Our typical information is a historical record of daily asset prices, supplemented in the later chapters by more frequent price observations and by recent option prices. Figure 1.1 shows a year of daily closing levels for the Standard & Poor 500-share index, from June 2003 until May 2004. These numbers could be used at the end of May to answer questions like, What is the chance that the index will be above 1200 at the end of June? Figure 1.2 shows daily observations during the same year for an index of volatility for the S&P 500 index, called VIX, that is calculated from option prices. These numbers are useful when predicting the future volatility of the US stock market.
Studying daily price data and probability models provides a good introduction to asset price dynamics, so we focus on daily data in Chapters 4–11. More can be learnt from more-frequent price observations, as we will later see in Chapters 12 and 15. Option prices are also informative about future asset prices and their study requires models that are specified for a continuous time variable, as in Chapters 13 and 14.
1.5 Contents
The book is divided into five parts, which follow this introductory chapter.
The first part provides a foundation for the empirical modeling of time series of returns from financial assets. Chapter 2 explains how returns from investments are calculated from prices. A set of regularly observed prices can be used to define a time series of returns. Several examples are presented and advice is given about data-collection issues. Chapter 3 commences with a summary of the theoretical properties of random variables. It then continues with the definitions and properties of important probability models for time-ordered sequences of random variables, called stochastic processes. Consideration is given to a variety of stochastic processes that are used throughout the book to develop descriptions of the dynamic behavior of asset prices.
Chapter 4 surveys general statistical properties of time series of daily returns that are known as stylized facts. Any credible stochastic process that represents asset price dynamics must be able to replicate these facts. Three stylized facts are particularly important. First, the distribution of returns is not normal. Second, the correlation between today’s return and any subsequent return is almost zero. Third, there are transformations of returns that reveal positive correlation between observations made at nearby times; an example is provided by the absolute values of returns.
The second part presents methods and results for tests of the random walk and efficient market hypotheses. The random walk hypothesis asserts that price changes are in some way unpredictable. Chapter 5 defines and evaluates the popular variance-ratio test of the hypothesis, which relies on a comparison between the variances of single-period and multi-period returns. It is followed in Chapter 6 by several further tests, which use a variety of methods to look for evidence that tomorrow’s return is correlated with some function of previous returns. Evidence against the random walk hypothesis is found that is statistically significant but not necessarily of economical importance. Chapter 7 evaluates the performance of trading rules and uses their results to appraise the weak form of the efficient market hypothesis. These rules would have provided valuable information about subsequent prices in past decades, but their usefulness may now have disappeared.
The third part covers the dynamics of discrete-time asset price volatility. Chapter 8 summarizes five interpretations of volatility, all of which refer to the standard deviation of returns. It then reviews a variety of reasons for volatility changes, although these can only provide a partial explanation of this phenomenon. Chapter 9 defines ARCH models and provides examples based upon some of the most popular specifications. These models specify the conditional mean and the conditional variance of the next return as functions of the latest return and previous returns. They have proved to be highly successful explanations of the stylized facts for daily returns. Chapter 10 describes more complicated ARCH models and the likelihood theory required to perform hypothesis tests about ARCH parameters. Guidance concerning model selection is included, based upon tests and diagnostic checks. Chapter 11 is about stochastic volatility models, which are also able to explain the stylized facts. These models represent volatility as a latent and hence unobservable variable. Information about the dynamic properties of volatility can then be inferred by studying the magnitude of returns and by estimating the parameters of specific volatility processes.
The fourth part describes high-frequency prices and models in Chapter 12. The returns considered are now far more frequent than the daily returns of the preceding chapters. Many examples are discussed for returns measured over five-minute intervals. Their stylized facts include significant variations in the average level of volatility throughout the day, some of which can be explained by macroeconomic news announcements. The additional information provided by intraday returns can be used to estimate and forecast volatility more accurately.
The fifth and final part presents methods that use option prices to learn more about future price distributions. Most option pricing models depend on assumptions about the continuous-time dynamics of asset prices. Some important continuous-time stochastic processes are defined in Chapter 13 and these are used to represent the joint dynamics of prices and volatility. Option pricing models are then discussed in Chapter 14 for various assumptions about volatility: constant, stochastic, or generated by an ARCH model. The empirical properties of implied volatilities are discussed, these being obtained from observed asset and option prices by using the Black–Scholes formulae. Chapter 15 compares forecasts of future volatility. Forecasts derived from option-implied volatilities and intraday asset prices are particularly interesting, because they incorporate more volatility information than the historical record of daily prices and often provide superior predictions.
Chapter 16 covers methods for obtaining densities for an asset price at a later date, with a particular emphasis on densities estimated using option prices. Several methods for obtaining risk-neutral densities from options data are described. These densities assume that risk is irrelevant when future cash flows are priced. Consequently, they are transformed to produce asset price densities that incorporate risk aversion.
1.6 Software
Some of the most important calculations are illustrated using Excel spreadsheets in Sections 5.4, 7.6, 9.4, 9.8, 11.4, 11.7, 14.3, and 16.10. Excel is used solely because this software will be available to and understood by far more readers than alternatives, such as Eviews, Gauss, Matlab, Ox, and SAS. Some of these alternatives contain modules that perform many useful calculations, such as the estimation of ARCH models, and it should be a straightforward task to recode any of the examples. The spreadsheets use several Excel functions that are explained by Excel’s Help files. More elegant spreadsheets can be obtained by using the Visual Basic for Applications (VBA) programming language.
1.7 Web Resources
Additional information, including price data, end-of-chapter questions, and instructions about sending email to the author, are available online. Some of the questions are empirical, others are mathematical. For all web material, first go to
http://pup.princeton.edu/titles/8055.html
and then follow the link to the author’s web pages.
Part I
Foundations
2
Prices and Returns
Methods for creating time series of market prices and returns to investors are described and illustrated in this chapter.
2.1 Introduction
Any empirical investigation of the behavior of asset prices through time requires price data. Some questions to be answered are, Where will we find our data?, How many years of data do we want to analyze?, and How many prices for each year do we wish to obtain?Advice on these topics and ...
Table of contents
- Cover
- Title
- Copyright
- Contents
- Preface
- 1 Introduction
- I: Foundations
- II: Conditional Expected Returns
- III: Volatility Processes
- IV: High-Frequency Methods
- V: Inferences from Option Prices
- Symbols
- References
- Author Index
- Subject Index
Frequently asked questions
Yes, you can cancel anytime from the Subscription tab in your account settings on the Perlego website. Your subscription will stay active until the end of your current billing period. Learn how to cancel your subscription
No, books cannot be downloaded as external files, such as PDFs, for use outside of Perlego. However, you can download books within the Perlego app for offline reading on mobile or tablet. Learn how to download books offline
Perlego offers two plans: Essential and Complete
- Essential is ideal for learners and professionals who enjoy exploring a wide range of subjects. Access the Essential Library with 800,000+ trusted titles and best-sellers across business, personal growth, and the humanities. Includes unlimited reading time and Standard Read Aloud voice.
- Complete: Perfect for advanced learners and researchers needing full, unrestricted access. Unlock 1.5M+ books across hundreds of subjects, including academic and specialized titles. The Complete Plan also includes advanced features like Premium Read Aloud and Research Assistant.
We are an online textbook subscription service, where you can get access to an entire online library for less than the price of a single book per month. With over 1.5 million books across 990+ topics, we’ve got you covered! Learn about our mission
Look out for the read-aloud symbol on your next book to see if you can listen to it. The read-aloud tool reads text aloud for you, highlighting the text as it is being read. You can pause it, speed it up and slow it down. Learn more about Read Aloud
Yes! You can use the Perlego app on both iOS and Android devices to read anytime, anywhere — even offline. Perfect for commutes or when you’re on the go.
Please note we cannot support devices running on iOS 13 and Android 7 or earlier. Learn more about using the app
Please note we cannot support devices running on iOS 13 and Android 7 or earlier. Learn more about using the app
Yes, you can access Asset Price Dynamics, Volatility, and Prediction by Stephen J. Taylor in PDF and/or ePUB format, as well as other popular books in Business & Finance. We have over 1.5 million books available in our catalogue for you to explore.