A Nobel Prize–winning economist tells the remarkable story of how the world has grown healthier, wealthier, but also more unequal over the past two and half centuries
The world is a better place than it used to be. People are healthier, wealthier, and live longer. Yet the escapes from destitution by so many has left gaping inequalities between people and nations. In The Great Escape, Nobel Prize–winning economist Angus Deaton—one of the foremost experts on economic development and on poverty—tells the remarkable story of how, beginning 250 years ago, some parts of the world experienced sustained progress, opening up gaps and setting the stage for today's disproportionately unequal world. Deaton takes an in-depth look at the historical and ongoing patterns behind the health and wealth of nations, and addresses what needs to be done to help those left behind.
Deaton describes vast innovations and wrenching setbacks: the successes of antibiotics, pest control, vaccinations, and clean water on the one hand, and disastrous famines and the HIV/AIDS epidemic on the other. He examines the United States, a nation that has prospered but is today experiencing slower growth and increasing inequality. He also considers how economic growth in India and China has improved the lives of more than a billion people. Deaton argues that international aid has been ineffective and even harmful. He suggests alternative efforts—including reforming incentives to drug companies and lifting trade restrictions—that will allow the developing world to bring about its own Great Escape.
Demonstrating how changes in health and living standards have transformed our lives, The Great Escape is a powerful guide to addressing the well-being of all nations.
- 376 pages
- English
- ePUB (mobile friendly)
- Available on iOS & Android
eBook - ePub
About this book
Trusted by 375,005 students
Access to over 1.5 million titles for a fair monthly price.
Study more efficiently using our study tools.
Information
Publisher
Princeton University PressYear
2013Print ISBN
9780691165622
9780691153544
eBook ISBN
9781400847969
ONE
The Wellbeing of the World
THE GREATEST ESCAPE in human history is the escape from poverty and death. For thousands of years, those who were lucky enough to escape death in childhood faced years of grinding poverty. Building on the Enlightenment, the Industrial Revolution, and the germ theory of disease, living standards have increased by many times, life spans have more than doubled, and people live fuller and better lives than ever before. The process is still going on. My father lived twice as long as either of my grandfathers; his real income as a civil engineer was many times the income of his father, who was a coal miner; and my education and income as a professor greatly exceed his education and his income. Mortality rates of children and of adults continue to fall throughout the world. But the escape is far from complete. A billion people suffer living standards, schooling, and life spans that are little better than those of their (or our) forebears. The Great Escape has made a world of difference to those of us who are richer, healthier, taller, bigger, and better educated than our grandparents and their grandparents. It has also made a world of difference in another, less positive sense: because much of the world’s population was left behind, the world is immeasurably more unequal than it was three hundred years ago.
This book tells the story of the Great Escape, of the benefits to mankind that it brought, and how it was responsible for today’s unequal world. It also explains what we need to do—or not to do—to help those who are still trapped in deprivation.
I use the term wellbeing to refer to all of the things that are good for a person, that make for a good life. Wellbeing includes material wellbeing, such as income and wealth; physical and psychological well-being, represented by health and happiness; and education and the ability to participate in civil society through democracy and the rule of law. Much of this book will focus on two of these components, health and wealth; in this overview I also say something about happiness.
I start with an overview of wellbeing in the world as it is today, and how it has changed over the last thirty to fifty years. I present the basic facts with only minimal explanation; in later chapters I shall explore individual topics in more detail, ask how we got here, and where and how we should be going next.
Health and Wealth
Health is the obvious starting point for an enquiry into wellbeing. You need a life to have a good life, and poor health and disability among the living can severely limit the capability to enjoy an otherwise good life. So I begin with life itself.
A girl born in the United States today can expect to live for more than 80 years. This official estimate is in fact very conservative because it ignores any future reductions in mortality that might take place during her life; given past progress, it is implausible that progress will suddenly stop. Of course, it is hard to project future health improvements, but a reasonable guess would be that a white, middle-class girl born in affluent America today has a 50-50 chance of making it to 100.1 This is a remarkable change from the situation of her great-grandmother, born in 1910, say, who had a life expectancy at birth of 54 years. Of all the girls born in the United States in 1910, 20 percent died before their fifth birthday, and only two out of every five thousand lived to celebrate their hundredth birthday. Even for her grandmother, born in 1940, life expectancy at birth was 66, and thirty-eight out of every thousand girls born in 1940 did not make it to their first birthday.
These historical differences pale in comparison with the differences between countries today. There are many places in the world whose health today is worse than it was in the United States in 1910. A quarter of all children born in Sierra Leone (or Angola or Swaziland or the Democratic Republic of the Congo or Afghanistan) will not live to see their fifth birthday, and life expectancy at birth is only a little above 40. Women typically bear between five and seven children, and most mothers will suffer through the death of at least one of their children. In these countries, one out of every thousand births leads to the death of the mother, a risk that accumulates to one in a hundred for women who have ten children. Bad though these numbers are, they are much better than those a few decades ago: even in the worst places, where nothing else seems to go right, the chances of dying have been falling. In some of the countries with the worst outcomes, such as Swaziland, if children make it past age 5, they run the risk of HIV/AIDS, which has greatly increased the risk of dying in the young adult years—a time of life when very few usually die. But such horrors are not universal in tropical countries, or even in all poor countries. There are many countries, including at least one tropical country (Singapore), where a newborn has survival chances as good as or better than those in the United States. Even in China and India (which in 2005 contained between them more than a third of the world’s people and almost half of the world’s poorest people), newborns today can expect to live for 64 years (India) and 73 years (China.)
Later in this chapter, I say more about where these numbers come from, but it is worth emphasizing now that the poorer the country, the worse its health statistics tend to be. Even so, we have good information about the deaths of children—the fractions who die before age 1 or age 5—but much worse information about adult deaths—including maternal mortality rates, or how long a 15-year-old can expect to live.
Health is not just a matter of being alive, and living a long time, but of living in good health. Good health has many dimensions and is harder to measure than the mere fact of whether or not someone is alive, but here too there is evidence of improvement over time as well as of differences between rich and poor countries. People in rich countries report less pain and less disability than people in poor countries. Disability has been falling over time in rich countries. IQ scores are rising over time. In most of the world, people are getting taller. Those who do not get enough to eat as children, or who live through childhood diseases, often do not grow as tall as their genes would have allowed under ideal conditions. Being shorter than they ought to have been may indicate early life misfortunes that compromise brain development and further restrict their opportunities in adult life. Europeans and Americans are taller than Africans, on average, and much taller than Chinese or Indians. Grown children are taller than their parents, and taller still than their grandparents. Global improvements in health and income, as well as global inequalities, can even be seen in people’s bodies.
Differences in health are often mirrored by differences in material living standards or in poverty. Americans are much richer than they were in 1910 or in 1945, and the countries with the lowest life expectancies today have incomes that are a(n almost incredibly) tiny fraction of American incomes today. The (grotesquely misnamed) Democratic Republic of the Congo (DRC, and known as Zaire under the rule of Joseph Mobutu from 1965 to 1997) has a per capita national income that is about three-quarters of 1 percent of the per capita national income of the United States. More than half the population of the DRC lives on less than a dollar per person per day; the fractions for Sierra Leone and Swaziland are similar. Some of the worst places are not even documented because they are currently engulfed in conflict; Afghanistan is one example.
According to the U.S. Census Bureau, 14 percent of the American population was poor in 2009, but the poverty line in the United States is much higher, around $15 a day. It is hard to imagine living in the United States on a dollar per person per day (although one calculation suggests that $1.25 is possible if we exclude the cost of housing, health, and education),2 yet this, or something close to it, is typical of what the very poorest people in the world survive on.
The link between life expectancy and poverty, although real enough, is far from exact. In China and India, with life expectancies of 73 and 64 years, respectively, many people live on less than a dollar a day—about a quarter of the population in India and a seventh of the rural population in China. And although the Chinese economy will soon overtake the U.S. economy in total size, per capita incomes in China are only around 20 percent of American incomes; on average five Chinese share the income of one American. There are other, even poorer countries that do well in life expectancy. Bangladesh and Nepal, with life expectancies in the mid-60s, are examples; Vietnam is only a little better off but in 2005 had a life expectancy of 74.
There are also some rich countries that do much worse than their incomes warrant. A notable example is the United States, whose life expectancy is one of the lowest among the richest countries. Another case of a different kind is Equatorial Guinea, which in 2005 had a per capita income that was bloated by oil revenues, but a life expectancy of less than 50 years. Equatorial Guinea, once a Spanish colony in West Africa, is ruled by President Teodoro Obiang Nguema Mbasogo, who has a good claim to the highly contested title of Africa’s worst dictator and whose family is the beneficiary of most of the country’s revenue from exporting oil.
High life expectancy, good health, the absence of poverty, democracy, and the rule of law are among the features that we would include were we to design an ideal country. They allow people to live good lives and to pursue what is important to them. Yet, without asking people, we don’t know exactly what they care about, how they might trade off health and income, or even the extent to which these things matter to them at all. People are sometimes capable of adapting to what might seem intolerable conditions, and perhaps they can extract some modicum of happiness or even live a good life in places where mortality and poverty are common—as it were, prospering in the valley of the shadow of death. Poor people may report that they are living good lives in the most difficult conditions, and rich people, who seem to have everything, may feel that their lives are deeply unsatisfactory.
In such cases, we might still choose to measure their wellbeing in terms of the opportunities that people have to lead a good life, rather than what they themselves make of their lives. That a poor man is happy and adaptable does not detract from his poverty any more than the misery or greed of a billionaire detracts from his wealth. A focus on what Amartya Sen calls “capabilities” leads to an examination of freedom from deprivation in terms of the possibilities that are opened up by objective circumstances, rather than what people make of, or feel about, those circumstances.3 Yet feeling that one’s life is going well is good in and of itself, and it is better to be happy than to be sad. Those feelings contribute to a good life, and it is important to ask people about them, even if they are not given any special priority in the assessment of wellbeing. This is a different position from that proposed by some utilitarians, such as the economist Richard Layard,4 who argue that self-assessed happiness is the only thing that is important, that good circumstances are good only insofar as they promote happiness, and that bad circumstances are not bad if people are happy in spite of them. Even so, as we saw from Figure 1 and 2 in the Introduction, it turns out that people are not at all content with their lives in countries where life is nasty, brutish, and short, and that the inhabitants of the rich, long-lived countries are generally well aware of their good fortune.
Life Expectancy and Income in the World
To look at the general patterns—as well as to pick out the exceptions, which are often of great interest—we need to look at the world as a whole, mapping patterns of health, wealth, and happiness. One of the most useful ways of doing this was pioneered by the demographer Samuel Preston in 1975.5 Preston’s picture, updated to 2010, is redrawn in Figure 1; it shows life expectancy and income around the world.
The horizontal axis shows GDP per capita of each country while the vertical axis shows life expectancy at birth for men and women taken together. Each country is shown as a circle, and the areas of the circles are proportional to population size. The huge circles in the middle of the plot are China and India, while the considerably smaller but still large circle at the top right is the United States. The curve that runs from bottom left to top right illustrates the general relation between life expectancy and national income, rising rapidly among the low-income countries and then flattening out among the rich, long-lived countries.
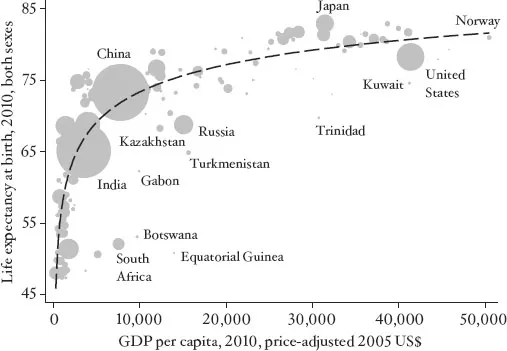
FIGURE 1 Life expectancy and GDP per capita in 2010.
GDP per capita is a measure of average income originating in each country and is measured here in a common unit across countries. The unit, the 2005 international dollar, is constructed so that, at least in principle, a dollar is worth the same in all countries and we are comparing like with like; an international dollar in Brazil or Tanzania buys the same as a dollar in the United States. GDP includes incomes that are not directly received by people or families, such as government tax receipts and the profits of firms and banks, as well as incomes that belong to foreigners. Generally only a fraction, albeit a substantial fraction, of GDP is available to households for their own purchases. Other components of GDP benefit households directly (government expenditures on education, for example), or indirectly (investment for the future). GDP, which is gross domestic product, is different from GNP, gross national product. GNP includes, and GDP excludes, income owned by residents but generated abroad, and GNP excludes, and GDP includes, incomes generated domestically but owned by foreigners. The difference is usually small, but it is very important for some countries. Luxembourg, where many earners live in Belgium, France, or Germany, is an example of a country where GNP is much smaller than GDP. Another is the tiny Chinese peninsula of Macau, now the world’s largest gambling casino. These two countries, which would appear beyond the right-hand boundary of the graph, are excluded, along with Qatar and the United Arab Emirates, oil-rich states that, along with Luxembourg and Macau, had the world’s highest levels of GDP per head in 2010. GNP is a better measure of national income, but the data are more consistently available for GDP, which is why I use it here and in many places throughout the book.
An important feature of the graph is the “hinge point” near China where the curve begins to flatten. The hinge point marks the epidemiological transition. For countries to the left of the transition, infectious diseases are important causes of deaths, and many of the deaths are among children, so that in the poorest countries, about half of all deaths are of children under the age of 5. After the transition, as we move to the richer countries, child deaths become quite uncommon...
Table of contents
- Cover Page
- Title Page
- Copyright Page
- Dedication Page
- Contents
- Preface
- Introduction: What This Book Is About
- 1 The Wellbeing of the World
- Part I Life And Death
- Part II Money
- Part III Help
- Postscript: What Comes Next?
- Notes
- Index
Frequently asked questions
Yes, you can cancel anytime from the Subscription tab in your account settings on the Perlego website. Your subscription will stay active until the end of your current billing period. Learn how to cancel your subscription
No, books cannot be downloaded as external files, such as PDFs, for use outside of Perlego. However, you can download books within the Perlego app for offline reading on mobile or tablet. Learn how to download books offline
Perlego offers two plans: Essential and Complete
- Essential is ideal for learners and professionals who enjoy exploring a wide range of subjects. Access the Essential Library with 800,000+ trusted titles and best-sellers across business, personal growth, and the humanities. Includes unlimited reading time and Standard Read Aloud voice.
- Complete: Perfect for advanced learners and researchers needing full, unrestricted access. Unlock 1.5M+ books across hundreds of subjects, including academic and specialized titles. The Complete Plan also includes advanced features like Premium Read Aloud and Research Assistant.
We are an online textbook subscription service, where you can get access to an entire online library for less than the price of a single book per month. With over 1.5 million books across 990+ topics, we’ve got you covered! Learn about our mission
Look out for the read-aloud symbol on your next book to see if you can listen to it. The read-aloud tool reads text aloud for you, highlighting the text as it is being read. You can pause it, speed it up and slow it down. Learn more about Read Aloud
Yes! You can use the Perlego app on both iOS and Android devices to read anytime, anywhere — even offline. Perfect for commutes or when you’re on the go.
Please note we cannot support devices running on iOS 13 and Android 7 or earlier. Learn more about using the app
Please note we cannot support devices running on iOS 13 and Android 7 or earlier. Learn more about using the app
Yes, you can access The Great Escape by Angus Deaton in PDF and/or ePUB format, as well as other popular books in Economics & Development Economics. We have over 1.5 million books available in our catalogue for you to explore.