![]()
PART 1
Profit
Since you are still looking at the book, it probably means that you have a small business and/or are about to start one. That’s great. One of the things that I have experienced is that when you own your own business, it gives you a sense of independence and means that you have a passion for what you are doing. It also means that you are probably going to work harder than a person who works for another corporation, and in doing so, you want to make more money than you would by working for a large corporation. Warren Buffett was once asked by a reporter why he kept the present management and gave them some ownership at some of the companies he bought. His reply was that ownership is critical. “Have you ever seen anyone wash a rental car?”
The purpose of this book is to give you some very factual and real points to work with in order to improve the profitability of your company. We are going to analyze, review, and attach sample sheets of items that you have to work with in order to be able to make a simplified profit and loss statement (P&L) work for you. One of the reasons you want your own business is to make money. Consequently, we need to see if we are making money sooner rather than later. That is why I like a weekly home grown P&L that you will have if you follow the chapter on separating fixed costs from variable costs. After a few months of adjusting our weekly P&Ls to what we received from a certified public accountant (CPA), we, most of the time, were within a couple of percentage points from the CPAs. I will explain costs to the point, where you won’t cringe when your CPA returns your monthly statement. You will have an in-house P&L sheet that will allow you to judge your performance and make any necessary adjustments. The only math will be in the beginning and is simple enough that a seventh grader can handle it.
![]()
CHAPTER 1
Fixed versus Variable Costs
If you are already operating a company, you probably have monthly or quarterly P&L sheets from your accountant. You will need to take these P&Ls and analyze each cost and put a V if it is a variable cost or an F if it is a fixed cost next to each expense item.
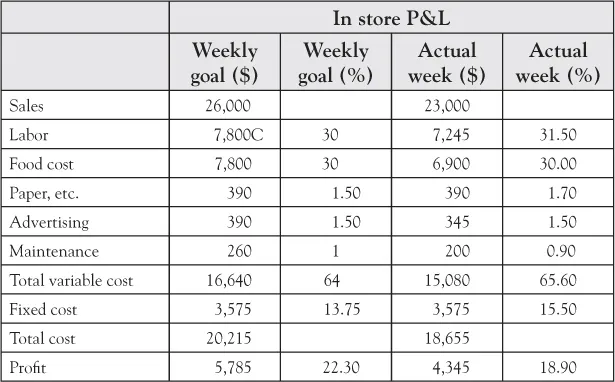
The key to analyzing and making it simple to run your business profitably is to condense expenses, so that you can easily monitor them on a weekly basis. In our restaurant group, we would look at only about three or four fixed items. As the term indicates, fixed items don’t vary much and we can estimate what they will be each week or month. For our operational P&Ls that we used in the store with the general managers, we would condense all of the fixed costs into one item. This fixed cost would include rent ($1,600/week), utilities ($300/week), and management salaries ($1,350/week), along with taxes and other obvious fixed items ($325/week). We then noted the variable costs and looked at five variable costs that the general manager of that store should be able to easily quantify and track. These variable costs included labor (30 percent), food cost (30 percent), paper soap and janitorial (1.5 percent), advertising (1.5 percent), and repairs and maintenance (1 percent). As a check, add the two (fixed and variable costs) together and make sure they equal the total cost. With our restaurants, we were able to adjust our labor and food orders by analyzing the sales per day. We will look at this in the discussion on metrics.
The above-mentioned sample P&L as used in the store would be like the following:
One company with which I shared this analysis method went to the extreme and did their P&L on a daily basis. On a $30 million company, they were able to improve their profitability from 1 million per year to 3 million per year. They took the condensed P&L into each of their manufacturing centers and were able to spot a problem quickly, so that it wouldn’t generate scrap down the line.
The owner of a music store with whom I worked reviewed his P&L with me and within just a matter of 3 hours we were able to separate the variable costs and fixed costs and spot where he was losing money, where he could make more money, and where he was making money. He was losing money on the sale of musical instruments. He was holding a large inventory of high-priced musical instruments; however, when his clientele came for lessons and/or instruction, they found they could buy the same item online at a much lower cost. In reviewing this, we found that he could sell the lower-priced items such as a $185 guitar, but not the higher-priced instruments. Consequently, we returned the higher-priced instruments and even took a hit on the restocking charge in order to raise cash and cut our losses.
We found that the biggest moneymaker was his rental of instruction rooms to various music school teachers and their students. We then analyzed his P&L for different events and found that he was breaking even or losing money on concerts for the parents of his students. We then adjusted the ticket price for the concerts to include all of his cost to put on the concert and also added a profit. What a difference; instead of working for nothing, he was in a position where he could make money and follow his passion.
In the following text, you will find sample sheets and P&Ls for a day care that will delineate examples of how to break down fixed costs and variable costs into a condensed P&L.
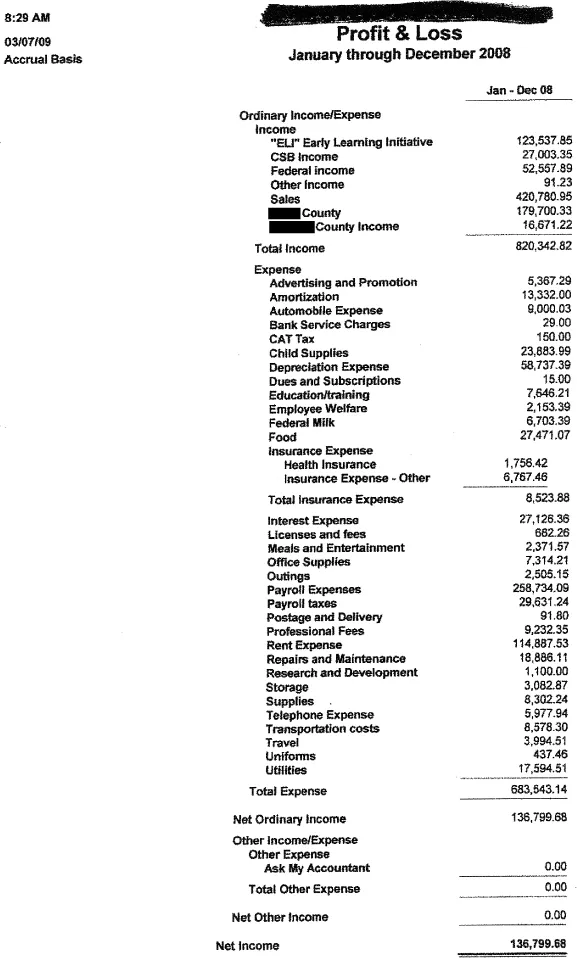
Sheet A is an actual P&L that was done by a CPA and used on his tax return.
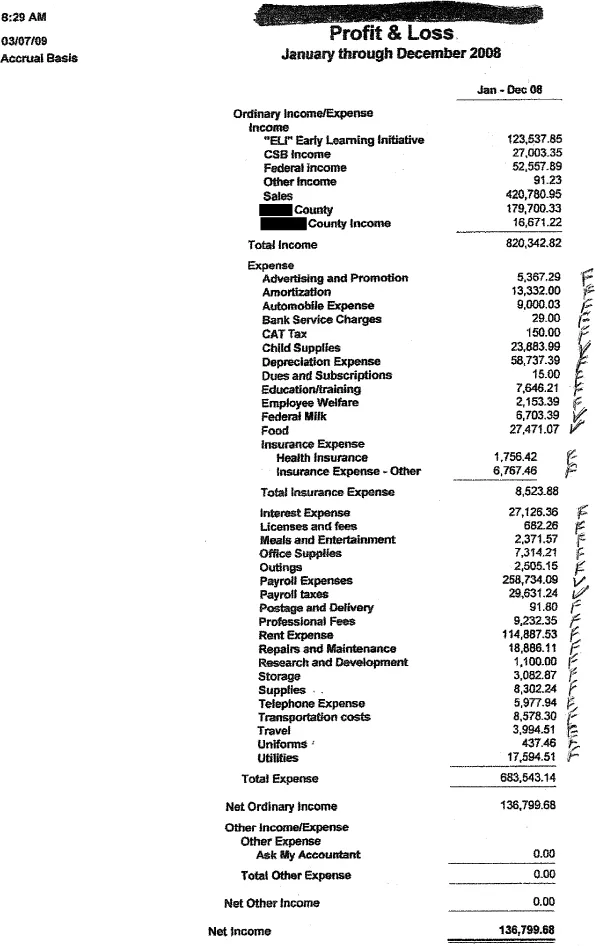
Sheet B is the same P&L that we reviewed and assigned a V for variable cost or an F for fixed cost.
I have found that you can learn more about your business by actually putting a percentage for each cost (fixed or variable), as a percentage of the total revenue. For instance, the variable cost for the teachers is $258,734.09. As a percentage of the total revenue of $820,342.82, this represents 31.5 percent of the income (revenue). This is by far the largest variable cost.
Let’s now use this information to help us make or improve our profit.
Let’s look at Table 1.1 (showing the condensed P&L for a preschool and day care). The variable cost for teachers is 31.5 percent. The number of students per teacher is 10. Consequently, if the students enrolled in each of your classes are only 5 in number, the variable cost becomes 63 percent. This difference alone means you will lose money. If your profit was 16.7 percent as shown, you will now lose 14.8 percent. What was suggested in this case is that we wait-list the classes until we get the proper number of students.
A review of the condensed P&L will show what the profit or loss is if you run the day care as it had been run. We also show what happens if we have a good revenue week and adjust our variable costs as necessary. It also shows what happens if we have a poor revenue week and adjust our costs accordingly. And finally, we show a poor revenue week where we don’t adjust our costs. If on an $11,000 week we lost only 1.14 percent and then one bad week occurs and we don’t adjust our costs, we lose 16.45 percent, a difference of 15.31 percent. This loss came about because the number of teachers was not adjusted. The previous column had 31.5 percent and 3.6 percent for the teachers and their payroll taxes respectively, a total of 35.1 percent. The failure to adjust sent those variable costs for teachers and payroll taxes to 45.23 percent and 5.18 percent or 50.41 percent. This is a difference of 15.31 percent. It is the same difference as the one in the bottom line. I hope this shows you how delicate the P&L is.
When we started working with another day care operator, she was operating out of a church using their Sunday school area. She had about 20 children and was just about breaking even or making a little money. Four years later she is now renting a much larger space and has about 100 students an...