![]()
1
The Divergent Development of Urban Regions
FOR THE FIRST TIME IN HUMAN HISTORY, MORE THAN HALF of the world’s population lives in urban areas. Eighty-five million people per year are moving to cities worldwide, most of them in the developing world. The most populated six hundred urban areas, or metropolitan regions, concentrate about a fifth of the world’s population and about half of world economic output; these proportions will rise to a quarter of the population and more than 60 percent of output in just the next fifteen years (McKinsey, 2011). Indeed, the concentration of economic output in cities is even starker: just 23 mega city-regions (with ten million people or more) produce about a quarter of world economic output. This is not just due to the rapid urbanization in the developing world. Fully 90 percent of U.S. economic growth since 1978 has come from 254 large cities and 50 percent from the 30 largest metropolitan regions. About half of U.S. employment is located on 1.5 percent of its land area.
Even though the world is urbanizing, cities continue to have very different levels of economic development. Within the United States, for example, large metropolitan regions (with more than 1 million people) have average per capita incomes that are 40 percent higher than the rest of the country. On a world scale, residents of larger cities earn incomes that are about four times the global average. Incomes in large urban areas range from about $2,000 per year in Cairo to about $75,000 in cities such as San Francisco, Oslo, and Hartford, Connecticut. Finally, significant differences remain in income levels among metropolitan regions within single countries; in the United States, per capita income in Brownsville, Texas, is $23,000 per year compared to about $75,000 in the San Francisco Bay Area or Washington, D.C., or about a one-to-three ratio.
Economies have forces that sometimes allow development levels to become more similar and others that sometimes pull them apart. The income levels of U.S. states converged from 1880 to 1980, where the richest state (Connecticut) went from being 4.5 times as rich as the poorest (Mississippi) to just 1.76 times. But such convergence came to a stop around 1980 (Ganong and Shoag, 2012). Over the course of that century, U.S. city-regions went up and down the income rankings, fluctuating much more than states. Intermetropolitan per capita income convergence also came to a halt sometime in the 1980s (Moretti, 2012; Drennan and Lobo, 1999; Yamamoto, 2007).
The pattern of income differences between countries and cities changes over time. For countries, economic historians refer to a Great Divergence: China was by far the richest nation in the world in 1492 and still had a higher per capita income than Spain or Britain in 1750. It spent the next two and a half centuries falling behind the West before beginning its climb back up the income ladder in recent years (Pomeranz, 2000; O’Rourke and Williamson, 1999). We now speak of a new “great divergence” in development between city-regions within countries (Moretti, 2012). This means that while it will be essential to promote and sustain urbanization as a key basis for prosperity in the twenty-first century, urbanization alone will not ensure prosperity for every city-region. In the United States, Detroit was the sixth richest metropolitan region in in 1970; it is now 52nd on the list. Boston is now one of the top five American metropolitan regions in income, but it has had many ups and downs in its four-century history and it was down and out as recently as 1980 (Glaeser, 2003).
In this book, we study the divergent fates of two great California city-regions,1 Los Angeles and San Francisco. In 1970, they had similar levels of per capita income and were fourth and first, respectively, among U.S. metropolitan regions. In 2010, they had almost a one third difference in per capita income and Los Angeles had slipped to 25th place. Throughout history, these kinds of changes in fortune have occurred in the world’s great city-regions, often due to war or political change. But in the case at hand, they occurred because of the way that two wealthy, highly developed city-regions entered the New Economy.
In typical lore about these two cities, Los Angeles is said to have fallen on hard times because of the loss of much of its aerospace sector after the end of the Cold War, a flood of low-skilled immigrants from Latin America, and governmental failure. San Francisco won the information age lottery, becoming the world center of that technological revolution and hosting highly skilled immigrants. But none of these factors explain why these two cities diverged from similar starting points, and we will demonstrate in this book that the divergent process of change was principally due to the different ways the two economies reshaped their social and economic networks, the practices of their firms, and the overall ecology of organizations in their economies.
Two Great City-Regions: Los Angeles and San Francisco
By any standard, the Los Angeles and San Francisco metropolitan regions are large, wealthy, and dynamic. Los Angeles, in this context, means the Greater Los Angeles metropolitan region (known officially as the Combined Statistical Area [CSA] encompassing five adjacent, continuously urbanized counties (Los Angeles, Orange and Ventura, and parts of San Bernardino and Riverside). Los Angeles is one of the largest economies in the world. In 2011, its nominal gross metropolitan product was $897 billion, which would make it the world’s 16th largest economy, after Mexico (112 million inhabitants) and before Indonesia (220 million).2 Los Angeles had 18.08 million residents in 2011, making it the second most populous metropolitan area in the United States. Meanwhile, the San Francisco Bay Area generated a gross metropolitan economic output of $575 million, with a population of 7.5 million, making it the world’s 22nd largest economy, just after Argentina (35 million) and before Sweden, with 9.6 million people.
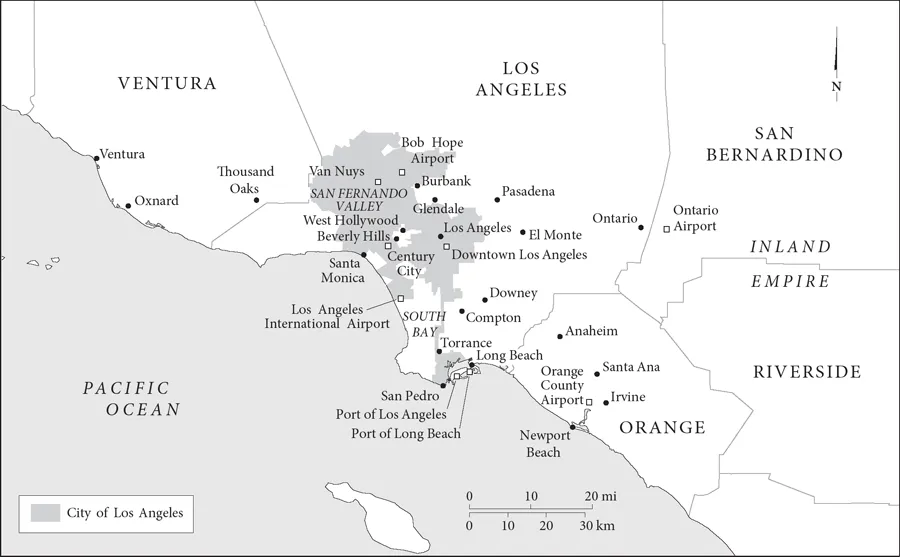
Los Angeles is perhaps best known for Hollywood’s entertainment industry, though it has a highly diversified economy. Its icons are the palm-lined streets of Beverly Hills and the mansions of Malibu, the hundred-mile string of wide sandy beaches along Santa Monica Bay and the Orange County coastline, its car-and-freeway landscape, and a way of life shaped by its year-round sunny, temperate climate. Los Angeles is frequently characterized as a vast suburban sprawl, but this is something of an illusion. Its settlements include sprawling neighborhoods of single-family houses, opulent villas, rustic canyon settlements, and beachside bungalows but also high-rise corridors and urban neighborhoods of medium-density apartments, all interlaced with commercial boulevards that stretch for long distances. As a whole, the Los Angeles metropolitan region has a higher average population density than the New York metropolitan area, and its population density is about 20 percent higher than that of the San Francisco Bay Area. Though it has a small downtown for a region its size, Los Angeles has several neighborhoods with double the average density of the City of San Francisco, the Bay Area’s urbanized core.
MAP 1.1 Greater Los Angeles
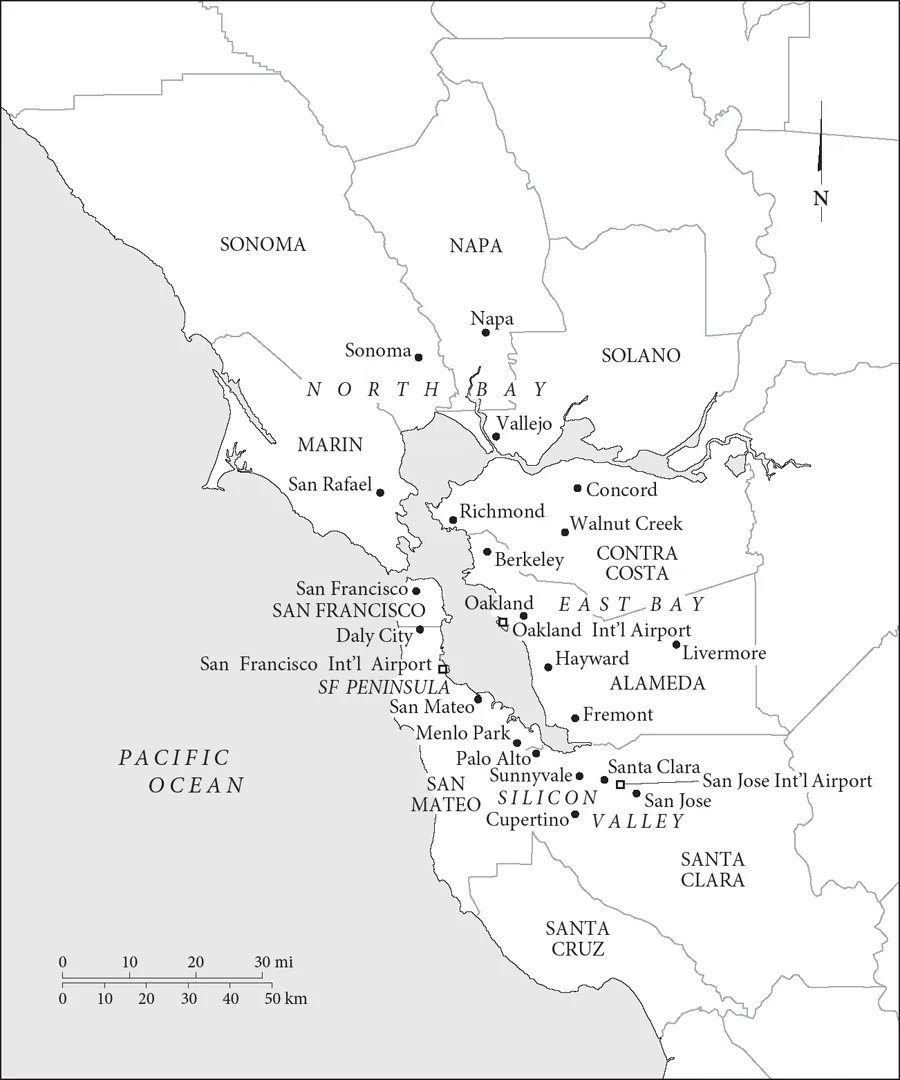
The San Francisco metropolitan area, which is also known as the Bay Area, is a Combined Statistical Area that until 2010 comprised ten varied counties, from the Sonoma and Napa wine country in the north to Silicon Valley and the Santa Cruz Mountains and coast in the south, and from the wild Pacific coastline to the west inland to the mountains separating it from the Central Valley of interior California.3 With metropolitan expansion, the definition of the region (defined by the U.S. Office of Management and Budget [OMB] as the San Jose–San Francisco–Oakland Combined Statistical Area) was expanded in 2012 to include two inland counties that contain dormitory suburbs in California’s interior Central Valley.4
The Bay Area is best known for the city of San Francisco: an iconically beautiful, hilly settlement surrounded by water and known worldwide for the Golden Gate Bridge, its waterfront, and colorful neighborhoods of ornate attached row houses. Outside the city of San Francisco, the Bay Area has densely urbanized areas in the East Bay (Oakland) and the low-density suburban megaregion of Silicon Valley. Its settlements are as diverse as those of Los Angeles, from forested rustic neighborhoods through typical California suburbs to dense European-style urban living.
Divergence: The Problem to Be Investigated in This Book
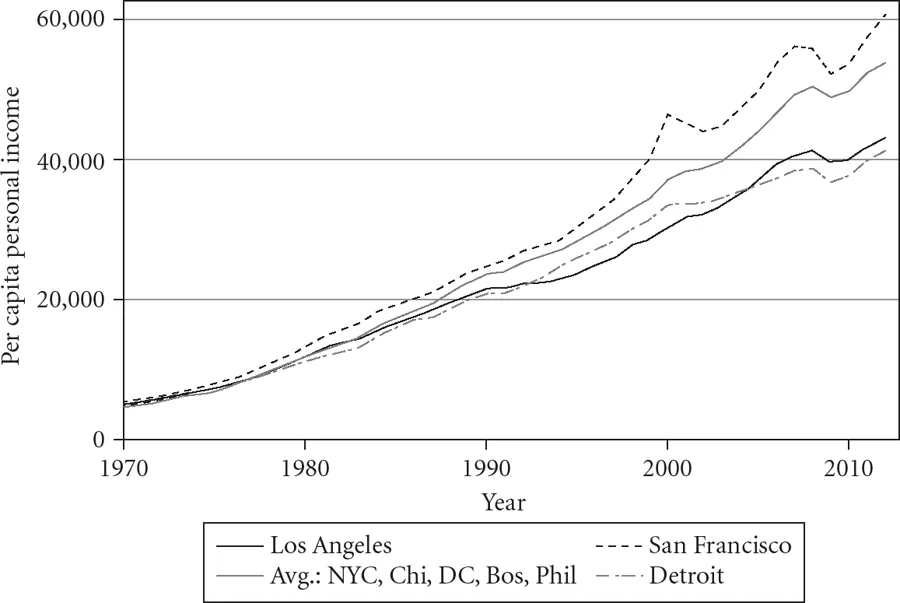
Depending on the method of calculation employed, the overall size of the economy (regional gross output) of the economy of Greater Los Angeles is third or fourth among metropolitan regions in the world, while that of the San Francisco Bay Area is about nineteenth. In terms of per capita income, inversely, San Francisco is consistently in the top five metro areas, and in a more select group of regions with more than 5 million people, it is usually first or second. In that latter group, Los Angeles ranks about 20th. For much of the twentieth century, Los Angeles successfully played catch-up in terms of income to its northern counterpart, all the while absorbing many more new people (Rand, 1967). Between 1970 and 1980, Los Angeles’s income level began to fall behind that of its northern neighbor. As Figure 1.1 illustrates, in 1970, per capita personal income levels in Los Angeles were 92 percent of those found in San Francisco. By 2012, they amounted to only 71 percent.5
MAP 1.2 San Francisco Bay Area
As seen in Figure 1.1, Los Angeles has not only failed to keep pace with the Bay Area, but it has been unable to match the performance of many other major American metropolises. In addition to our two California regions, the figure tracks per capita income dynamics between 1970 and 2012 for all other Consolidated Statistical Areas whose populations were over 5 million in 1970: New York–Newark, NY–NJ–CT–PA; Chicago–Naperville, IL–IN–WI; Washington–Baltimore–Arlington, DC–MD–VA–WV–PA; Philadelphia–Reading–Camden, PA–NJ–DE–MD; Boston–Worcester–Providence, MA–RI–NH–CT; and Detroit–Warren–Ann Arbor, MI.6 To make for a readable figure, incomes are averaged across New York; Chicago; Boston; Washington, D.C.; and Philadelphia, while the Detroit region is presented separately. Across these larger cities, Los Angeles most closely resembles Detroit. The larger story told in Figure 1.1 is that it is not sufficient to observe that the Bay Area is an especially fortunate case among American cities; San Francisco has indeed outperformed most metropolitan areas, but Los Angeles has foundered by that same standard.
Stated another way, the Bay Area and Los Angeles belonged to similar development clubs in 1970. Both regions had more educated workforces than the United States as a whole, and they hosted significantly higher proportions of Hispanics than the country as a whole. Both regions developed rapidly in resource-rich California, benefiting from business and financial links to the state’s agricultural and natural resources hinterlands. Both nurtured dynamic and variegated manufacturing and service economies. Both benefited from large-scale federal procurement of military hardware from their regional firms. Both were centers of innovation in knowledge- and technology-intensive sectors, producing iconic goods for global markets such as airplanes, semiconductors, communications equipment, and entertainment. Both hosted major scientific research communities, consisting of 6 of the world’s top-20-ranked research universities, as well as government research laboratories, independent institutes, large private firms with research and development (R&D) operations, and research hospitals. Migrants were attracted to their natural beauty, excellent climates, and high quality of life, thus sustaining high real estate prices and continued expansion of local markets for nontradable goods and services. Both shared California’s relatively progressive governmental structure, institutions, infrastructure, and education policies.
FIGURE 1.1 The evolution of per capita personal incomes in large metropolitan areas, 1970–2012
SOURCE: Authors’ calculations using Bureau of Economic Affairs Regional Economic Accounts data.
NOTE: Combined Statistical Area (CSA) definitions are used, with boundaries laid out by the Office of Management and Budget in bulletin no. 13-01, issued February 28, 2013. CSAs represented in this chart comprise the list of regions that had populations over 5 million in 1970.
Thus we arrive at the question that is at the center of this book: given similar incomes and wages in 1970 and all of these common developmental characteristics, why did San Francisco surge forward and Los Angeles fall so far behind?
Several Facets of Divergence
Urban and development economics compare economic well-being by correcting money incomes for different levels of local prices, as a way to identify “real” income. Internationally, this involves correcting for purchasing power parity; interregionally, it principally involves correcting for housing prices, the major reason why living costs differ from place to place. For instance, in the years 2007–2008, nominal income in Los Angeles was 70 percent of that of the Bay Ar...