How do meteorologists design forecasts for the next day's, the next week's, or the next month's weather? Are some forecasts more likely to be accurate than others, and why? Making Sense of Weather and Climate takes readers through key topics in atmospheric physics and presents a cogent view of how weather relates to climate, particularly climate-change science. It is the perfect book for amateur meteorologists and weather enthusiasts, and for anyone whose livelihood depends on navigating the weather's twists and turns.
Making Sense of Weather and Climate begins by explaining the essential mechanics and characteristics of this fascinating science. The noted physics author Mark Denny also defines the crucial differences between weather and climate, and then develops from this basic knowledge a sophisticated yet clear portrait of their relation. Throughout, Denny elaborates on the role of weather forecasting in guiding politics and other aspects of human civilization. He also follows forecasting's effect on the economy. Denny's exploration of the science and history of a phenomenon we have long tried to master makes this book a unique companion for anyone who wants a complete picture of the environment's individual, societal, and planetary impact.
- English
- ePUB (mobile friendly)
- Available on iOS & Android
eBook - ePub
About this book
Trusted by 375,005 students
Access to over 1.5 million titles for a fair monthly price.
Study more efficiently using our study tools.
Information
Topic
Physical SciencesSubtopic
Global Warming & Climate Change1

Feeling the Heat
The sun, with all those planets revolving around it and dependent on it, can still ripen a bunch of grapes as if it had nothing else in the universe to do.
Galileo Galilei
Weather is all about air and water being moved around (and being heated and cooled). Such activity requires energy to drive it; the energy that drives our weather comes from the sun in the form of heat. In this chapter, we describe the basic physics that determines the energy balance of our planet and, in particular, will see why Earth’s average temperature is what it is.
Local Astronomy
Galaxies are collections of billions of large thermonuclear reactors that we call “stars,” loosely held together by gravity. Our local thermonuclear reactor, named “sun,” is a ball of plasma tightly held together by gravity. The complicated nuclear reactions and the equally complicated fluid dynamics of our sun are not the subject of this book: suffice it to say that the sun is a rotating sphere of radius 696,000 kilometers (432,474 miles) with a surface temperature of about 5,500°C (9,900°F). Each square meter of this surface radiates 63 megawatts of electromagnetic power—that’s the output of a small power station. For a refresher on electromagnetic (EM) radiation, see box 1.1. Do the math, and you will find that the total power generated by the sun (its luminosity), and radiated out to the rest of the universe, is about 3.85 × 1026 watts (385 trillion trillion watts).
Box 1.1
Electromagnetic Radiation
Light and microwaves; ultraviolet radiation and heat (also known as “infrared radiation”); and radio waves, X-rays, and gamma rays are all the same in that they are EM waves that all travel at the universal speed limit—the speed of light. They differ only in frequency (equivalently, in wavelength) and in the amount of energy they carry, which is proportional to frequency. Thus a ray of ultraviolet light of frequency 1016 Hz (10,000,000,000,000,000 cycles per second) has 100 times as much energy as an infrared ray of frequency 1014 Hz. Box figure 1.1 shows a broad section of the EM spectrum. What we call “light” is that small band that our eyes can detect. What we call “heat” is a lower frequency band that we can feel but not see. The sun’s energy is mostly EM radiation at infrared, visible, and ultraviolet frequencies.
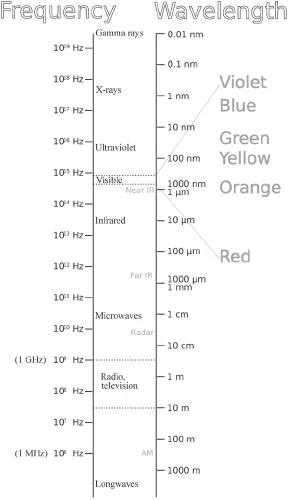
Box Figure 1.1 The electromagnetic spectrum. Frequency is expressed in Hz (cycles per second), and wavelength is in meters (m), centimeters (cm), millimeters (mm), micrometers (µm [millionths of a meter]), and nanometers (nm [billionths of a meter]). The energy of a photon (an elementary particle of light, zillions of which constitute an electromagnetic wave) is proportional to its frequency. The electromagnetic power emitted by the sun peaks in the visible region. (Adapted by the author from a figure by Victor Blacus)
The sun’s tremendous power radiates out in all directions equally, and so the fraction of this power that bathes Earth is easy to work out (for interested readers, the simple geometric calculation is provided in the appendix). The result is that 1.7 × 10¹⁷ watts of solar EM radiation reaches our upper atmosphere.
There are a couple of important details that this simple estimate sweeps under the carpet, however. First it assumes that Earth’s orbit about the sun is circular. This is not quite true: the orbit is elliptical—the closest point to the sun and the farthest point differ by 1.6%. This difference does not matter much for us; it is a good approximation to say that the ellipse is almost a circle. Second, the solar radiation that reaches our upper atmosphere is not the same as the radiation that heats Earth and drives its weather. The radiation absorbed by Earth is less than the incident radiation by about one-third as a result of reflection off the atmosphere, off clouds within it, and off the surface of our planet. We will investigate the details later; the idea is illustrated in figure 1.1. It is enough for now to say that the solar power that is absorbed by Earth is a (nearly) constant 1.23 × 10¹⁷ watts.
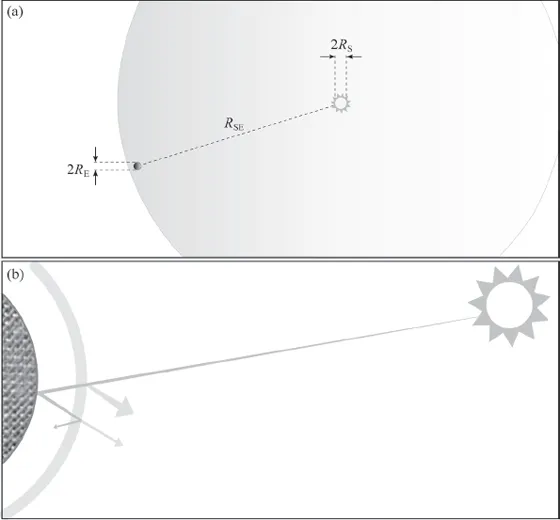
Figure 1.1 Incoming solar power. (a) The orbit of Earth is approximately circular, of radius 150 million kilometers (93 million miles) (RSE). Electromagnetic power from the sun (radius RS) spreads evenly in all directions; given the size of Earth (radius RE) and its distance from the sun, it is not hard to work out the solar power that is intercepted by our planet (the calculation is in the appendix). (b) A ray of sunlight is either absorbed at the surface or reflected off it, or is absorbed by the atmosphere or reflected off it. About one-third of incident electromagnetic radiation is reflected back out into space—mostly from clouds. The rest is absorbed.
The output of our sun is not quite constant. As the sun is technically a variable star, its power oscillates slightly, varying in amplitude by about 1 W m−2 (watt per square meter) between the maximum and minimum values. This wobble is about 0.1% of the average power and so may seem to be a mere detail of interest only to astronomers, but in fact it has measurable consequences for our climate on Earth. The oscillations cycle every 11 years and correlate strongly with sunspot activity. Sunspots are magnetic disturbances that bubble to the surface. They are associated with polarity flips in the sun’s magnetic field—the north and south poles of the sun flip over every 11 years.1 There are other cycles that have been measured, either directly (from solar power output or magnetic field strengths) or indirectly (via proxy measurements on Earth, such as tree-ring growth and 14C abundances), with periods of 80 years, 200 years, and 1,000 years. The solar power output variations resulting from these cycles lead to global temperature variations here on Earth. This connection has been established for several hundred years dating from the Middle Ages to the present day. Thus the Spörer minimum (1410–1540) and the Maunder minimum (1645–1715)—years of harsh winters and cool and wet summers—correspond to periods of low solar activity. A strong statistical correlation between solar power and global mean surface temperatures since 1610 has been established recently (though this correlation certainly does not account for global warming).2
The Blue-Green Planet
In chapter 2, we will need more detail, about the differing characteristics of Earth’s surface—for example, how land and ocean reflect EM radiation to differing degrees. Here we are concentrating on the amount of heat energy from the sun that is absorbed by our planet. What about that other source of heat, known to every underground miner? Near the surface, for every kilometer (0.6 mile) that we descend underground, the temperature increases by 25°C (45°F). The center of Earth is believed to be solid iron at about 7,000°C (12,600°F), under very high pressure. This inner core is surrounded by a fluid outer core consisting mostly of molten iron. Between the outer core and the surface crust is the mantle, an inhomogeneous mixture of hot or molten rock. Where does all this heat come from, how much is there, and how much does it contribute to our weather and climate?
It was once thought that the internal heat of Earth was left over from a primordial fireball. That is, our planet began life as a molten blob of material—rock and metal—that coalesced and cooled. Indeed, at the end of the nineteenth century, the eminent physicist William Thomson (elevated to a peerage as Lord Kelvin)3 estimated the age of our planet from the rate at which the molten blob cooled. He came up with various figures by this method—100 million years, 24 million, 20 million—which pleased no one. At the time many people believed that Earth was created on October 22 or 23, 4004 B.C.E., according to calculations based on a literal reading of the Bible made by an Irish archbishop, James Ussher, in 1650. But the new science of geology was insisting on a much older age for our planet—many hundreds of millions of years. During this period, the relative roles of science and religion were frequently debated, in public as well as in the technical literature. (Evolutionary theory had been proposed by Charles Darwin a few decades earlier, and was very controversial at the time. The evolutionists had a dog in the “age of Earth” fight; they sided with the geologists in advocating a much older planet than Kelvin calculated.) Some of these debates became very heated—an appropriate description given Kelvin’s calculation.
The resolution came from an up-and-coming physicist named Ernest Rutherford, a New Zealander working at Cambridge University who, in an address in 1904 to a large audience that included Lord Kelvin, showed that radioactivity changed the game. Rutherford was a leading light in the new generation of scientists studying what we now call nuclear physics. Radioactivity had been discovered at the end of the nineteenth century by Henri Becquerel in France. Rutherford and his colleagues knew that many radioactive substances existed naturally in Earth’s interior and that these substances generate heat. Later calculations and measurements showed that radioactivity generates heat within our planet at the rate of 30 terawatts (1 terawatt is 1 trillion watts), which is more than the present-day power consumption of humanity. Also, measurements of radioactive decay show that Earth is 4,540 ± 50 million years old, in line with the requirements of geology and evolutionary biology.4
Thirty terawatts is a huge amount of power, but it is a drop in the bucket compared with the power absorbed by our planet from the sun. Solar heating contributes 4,000 times as much heat to Earth’s energy budget than does internal heating due to radioactivity. Thus we can answer the second question posed at the start of this section and say that the internal heat of our planet contributes negligibly to its heating and so contributes negligibly to our weather and climate. To a very good approximation, we can say that weather and climate arise from heating of Earth’s surface by the sun.
Blackbody Radiation
To understand the heating of our atmosphere and planetary surface by the sun in more detail, we need to appreciate an important concept in thermodynamics, that of a blackbody.5 This idealized object is a perfect absorber of heat; it reflects nothing and so would appear to be perfectly black, like soot—and soot is in fact pretty close to being an ideal blackbody. Such an idealization does not exist in the real world; heat is reflected off the surface, to a greater or lesser extent (as we have seen for Earth reflecting solar radiation). Even soot reflects some light; after all, we can see it. Nevertheless, the blackbody concept is a useful one for physicists because it almost applies in many cases—it is a good approximation—and because it can be analyzed theoretically.
A star such as our sun is very nearly a blackbody that is in thermal equilibrium with its surroundings; that is, it has a more or less constant surface temperature. A stove, similarly, is approximately a blackbody at thermal equilibrium.6 A blackbody that is in thermal equilibrium with its surroundings has a characteristic emission spectrum that is a function of its surface temperature. (This equation is discussed in the appendix.) That is, the amount of EM radiation it emits at each given frequency can be calculated. The power transmitted turns out to depend on only the surface temperature. This spectrum is shown for a blackbody with the same surface temperature as the sun in figure 1.2. Also shown in the figure is the actual spectrum of EM power of our sun—note that it follows closely the blackbody spectrum.
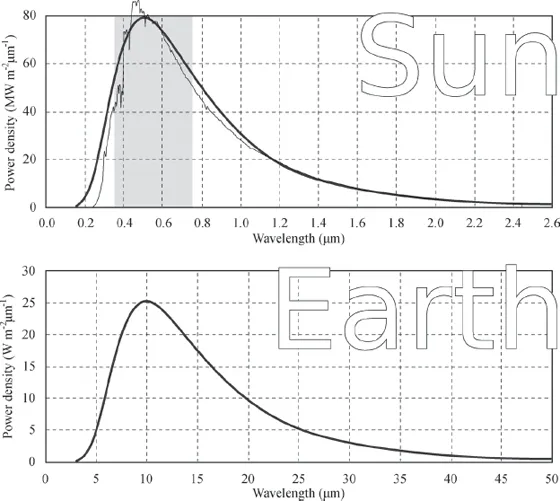
Figure 1.2 Emission spectra (power density per unit wavelength) for blackbodies with the same surface temperature as the sun and for Earth (thick lines). The actual solar spectrum (thin line in upper graph) is much more ragged, due to details of solar nuclear reactions and solar composition, but closely follows the blackbody curve. The visible part of the spectrum is shaded. Note that for Earth, the peak of the emission spectrum is at about 10 micrometers, in the infrared region. Note also the different scal...
Table of contents
- Cover
- Title Page
- Copyright
- Contents
- Author’s Note
- Acknowledgments
- Forecast
- 1. Feeling the Heat
- 2. Under the Heavens and the Seas
- 3. The Air We Breathe
- 4. Dynamic Planet
- 5. Oceans of Data
- 6. Statistically Speaking
- 7. A Condensed Account of Clouds, Rain, and Snow
- 8. Weather Mechanisms
- 9. Weather Extremes: The New Normal
- 10. The World of Weather Forecasting
- And That Wraps Up Your Weather for Today
- Appendix
- Glossary
- Notes
- Bibliography
- Index
Frequently asked questions
Yes, you can cancel anytime from the Subscription tab in your account settings on the Perlego website. Your subscription will stay active until the end of your current billing period. Learn how to cancel your subscription
No, books cannot be downloaded as external files, such as PDFs, for use outside of Perlego. However, you can download books within the Perlego app for offline reading on mobile or tablet. Learn how to download books offline
Perlego offers two plans: Essential and Complete
- Essential is ideal for learners and professionals who enjoy exploring a wide range of subjects. Access the Essential Library with 800,000+ trusted titles and best-sellers across business, personal growth, and the humanities. Includes unlimited reading time and Standard Read Aloud voice.
- Complete: Perfect for advanced learners and researchers needing full, unrestricted access. Unlock 1.5M+ books across hundreds of subjects, including academic and specialized titles. The Complete Plan also includes advanced features like Premium Read Aloud and Research Assistant.
We are an online textbook subscription service, where you can get access to an entire online library for less than the price of a single book per month. With over 1.5 million books across 990+ topics, we’ve got you covered! Learn about our mission
Look out for the read-aloud symbol on your next book to see if you can listen to it. The read-aloud tool reads text aloud for you, highlighting the text as it is being read. You can pause it, speed it up and slow it down. Learn more about Read Aloud
Yes! You can use the Perlego app on both iOS and Android devices to read anytime, anywhere — even offline. Perfect for commutes or when you’re on the go.
Please note we cannot support devices running on iOS 13 and Android 7 or earlier. Learn more about using the app
Please note we cannot support devices running on iOS 13 and Android 7 or earlier. Learn more about using the app
Yes, you can access Making Sense of Weather and Climate by Mark Denny in PDF and/or ePUB format, as well as other popular books in Physical Sciences & Global Warming & Climate Change. We have over 1.5 million books available in our catalogue for you to explore.