The first edition of this book was a first book for atomic spectroscopists to present the basic principles of experimental designs, optimization and multivariate regression. Multivariate regression is a valuable statistical method for handling complex problems (such as spectral and chemical interferences) which arise during atomic spectrometry. However, the technique is underused as most spectroscopists do not have time to study the often complex literature on the subject. This practical introduction uses conceptual explanations and worked examples to give readers a clear understanding of the technique. Mathematics is kept to a minimum but, when required, is kept at a basic level. Practical considerations, interpretations and troubleshooting are emphasized and literature surveys are included to guide the reader to further work. The same dataset is used for all chapters dealing with calibration to demonstrate the differences between the different methodologies. Readers will learn how to handle spectral and chemical interferences in atomic spectrometry in a new, more efficient and cost-effective way.
- English
- ePUB (mobile friendly)
- Available on iOS & Android
eBook - ePub
Basic Chemometric Techniques in Atomic Spectroscopy
About this book
Trusted by 375,005 students
Access to over 1.5 million titles for a fair monthly price.
Study more efficiently using our study tools.
Information
CHAPTER 1
An Overview of Atomic Spectrometric Techniques
1.1 Introduction: Basis of Analytical Atomic Spectrometric Techniques
Analytical atomic spectrometry comprises a great number of techniques based on distinct principles, with different performance characteristics and hence with varied application scopes, but in all cases providing elemental chemical information about the composition of samples. As shown in Figure 1.1, these techniques can be classified into three main groups according to the type of particle detected: optical spectrometry, where the intensity of either nonabsorbed photons (absorption) or emitted photons (emission and fluorescence) is detected as a function of photon energy (in most cases, plotted against wavelength); mass spectrometry (MS), where the number of atomic ions is determined as a function of their mass-to-charge ratio; and electron spectroscopy, where the number of electrons ejected from a given sample is measured according to their kinetic energy, which is directly related to the bonding energy of the corresponding electron in a given atom.
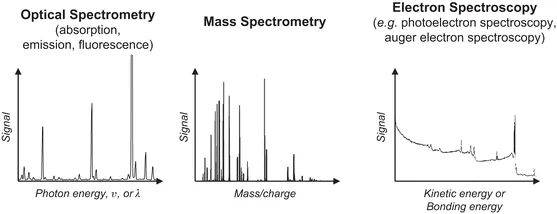
Figure 1.1 Classification of spectrometries according to the detection principle.
X-ray photoelectron spectroscopy (XPS) and Auger electron spectroscopy (AES) are the two main techniques based on electron spectroscopy. In XPS, a source of photons in the X-ray energy range is used to irradiate the sample. Superficial atoms emit electrons (called photoelectrons) after the direct transfer of energy from the photon to a core-level electron (see Figure 1.2a). Photoelectrons are subsequently separated according to their kinetic energy, and counted. The kinetic energy of the emitted photoelectrons will depend on the energy of the original X-ray photons (the irradiating photon source should be monochromatic) and also on the atomic and, in some cases, the molecular environment from which they come. This, in turn, allows knowledge of the sample elemental composition and also provides important information about oxidation states and chemical bonds because the stronger the binding to the atom, the lower the photoelectron kinetic energy.
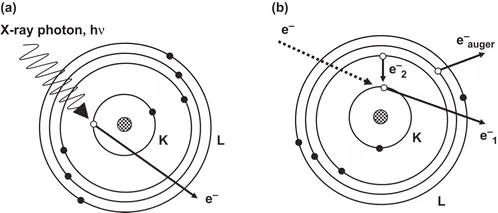
Figure 1.2 Electron spectroscopy. (a) Schematic representation of the XPS process. (b) Schematic representation of the processes for auger electron emission.
In an Auger process, the kinetic energy of the emitted electron does not depend on the energy of the excitation source. AES consists of a two-step process: first, the sample is irradiated with an electron beam (or, less commonly, with X-rays) which expels an inner electron (e–1). In the second step, the relaxation of the excited ion takes place through the fall of a more external electron (e–2) to fill the ‘hole’, and then a third electron (e–Auger) uses the energy released in that movement to exit the atom (Figure 1.2b). XPS and AES are considered powerful techniques for surface analysis, with good depth and lateral resolution. However, owing to the scarcity of applications in quantitative analyses, they will not be considered further.
The aim of this chapter is, therefore, to introduce briefly the most common quantitative atomic techniques based on both optical and mass spectrometric detection. The main emphasis will be placed on conceptual explanations in order to stress the advantages and disadvantages of each technique, the increase in the complexity of the data they generate and how this can be addressed. References to chemometric tools presented in the following chapters will be given.
For those techniques, a dissolved sample is usually employed in the analysis to form a liquid spray which is delivered to an atomiser (e.g. a flame, or electrically generated plasmas). Concerning optical spectrometry, techniques based on photon absorption, photon emission and fluorescence will be described (Section 1.2), while for MS particular attention will be paid to the use of an inductively coupled plasma (ICP) device as the atomisation/ionisation source (Section 1.3). The use of on-line liquid sample introduction systems, such as flow injection manifolds and chromatography, will be dealt with in Section 1.4, because they have become commonplace in most laboratories, opening up new opportunities for sample handling and pretreatment as well as to obtain element-specific molecular information.
Direct solid analysis by optical and mass spectrometry will be presented in Section 1.5. This alternative is becoming more appealing nowadays and is implemented in laboratories because of the many advantages brought about by eliminating the need to dissolve the sample. Techniques based on the use of atomisation/excitation/ionisation sources such as sparks, lasers and glow discharges will be briefly described in that section.
Finally, Section 1.6 deals with issues regarding quality control guidelines, instrument maintenance and troubleshooting.
1.2 Atomic Optical Spectrometry
Routine inorganic elemental analysis is carried out nowadays mainly by atomic spectrometric techniques based on measurement of the energy of photons. The most frequently used photons for analytical atomic spectrometry extend from the ultraviolet (UV: 190–390 nm) to the visible (Vis: 390–750 nm) regions. Here the analyte must be in the form of atoms in gas phase so that the photons interact easily with valence electrons. It is worth noting that techniques based on the measurement of X-rays emitted after excitation of the sample with X-rays (i.e. X-ray fluorescence or XRF) or with energetic electrons (electron-probe X-ray microanalysis or EPXMA) yield elemental information directly from solid samples, but they will not be explained here; instead they will be briefly treated in Section 1.5.
The measurement of analytes in the form of gaseous atoms provides atomic spectra. Such spectra are simpler to interpret than molecular spectra (since atoms cannot rotate or vibrate as molecules do; only electronic transitions can take place when energy is absorbed). Atomic spectra consist of very narrow peaks (e.g. a few picometres bandwidth) providing two types of key analytical information: the observed wavelength (or frequency or photon energy), which allows for qualitative analysis, and the measurement of the peak height or area at a given frequency, which provides quantitative information about the particular element sought. The relative simplicity of such atomic spectra and the fairly straightforward qualitative and quantitative information have led to the enormous practical importance of atomic optical spectrometry for inorganic elemental analysis. However, it should be stressed again that the analytes must first be converted into atoms which will absorb or emit photons of UV-Vis radiation and so an ‘atomiser’, for example a dynamic medium of high temperature where molecules are broken down into individual gaseous atoms, is needed.
1.2.1 Classification of Techniques: Absorption, Emission and Fluorescence
The interaction processes between UV-Vis photons and the outer electrons of the atoms of the analytes can be understood using quantum mechanics theory. In the thermodynamic equilibrium between matter and interacting electromagnetic radiation, according to the radiation laws postulated by Einstein, three basic processes are possible between the two stable energy levels 1 and 2. These processes, which are summarised in Figure 1.3, can be defined by their corresponding transition probabilities:
- Spontaneous emission of photons. This process refers to a spontaneous transition of the electron from the excited state 2 to the lower energy state 1 with emission of a photon of frequency v12 = (E2 –E1)/h. This process constitutes the photophysical basis of atomic emission spectrometry, which will be termed here optical emission spectrometry in order to use the acronym OES instead of AES because the latter acronym can be confused with that for Auger electron spectroscopy.
- Stimulated absorption of photons. In this case, the electronic transition takes place from state 1 to state 2 in response to the action of external radiation of the appropriate frequency. Atomic absorption spectrometry (AAS) is based on this process. On the other hand, fluorescence atomic spectrometry (AFS) corresponds to the sequential combination of a stimulated absorption followed by spontaneous emission.
- Stimulated emission of photons. This process consists of electronic transitions from the excited energy level to the lower one, stimulated by an external radiation of the appropriate frequency (E2 – E1)/h. It constitutes the basis of the laser (light amplification stimulated emission radiation) phenomenon.
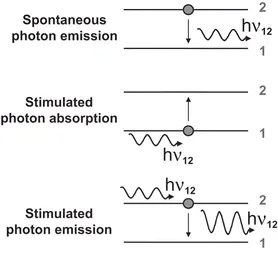
Figure 1.3 Basic interaction processes between matter and interacting electromagnetic radiation.
Atomic lines can arise from electronic transitions in neutral atoms or in atomic ions (in general, atomic lines for a given element M are named as M I, whereas their ionic counterparts are denoted M II). The transitions of outer electrons of an atom may be represented as vertical lines on an ‘energy level’ diagram, where each energy level of the outer electron possesses a given energy and is represented by a horizontal line. For example, Figure 1.4 shows the diagram for the sodium neutral atom (the wavelengths corresponding to the transitions in the diagram are expressed in angstroms, Å). The energy scale is linear in electronvolt (eV) units, assigning a 0 value to the 3s orbital. The scale extends up to about 5.2 eV, which corresponds to the necessary energy to extract the 3s electron and so to produce a sodium ion. All electronic transitions ending on the same energy level are usually called ‘series’, the most likely ones being those ending in the lowest possible energy level (the ground state) of the electron in the atom.
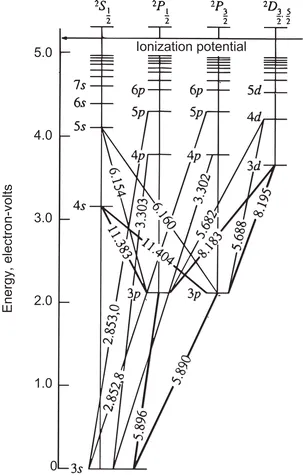
Figure 1.4 Diagram of energy levels and electronic transitions for atomic sodium.
The light coming from such transitions is separated according to its frequency (or its wavelength, λ) and the intensity observed for each frequency measured electronically (e.g. with a photomultiplier tube). Thus, if the observed intensity of the emitted light is plotted against the frequency (or wavelength) of the corresponding transition (line), an ‘atomic emission’ spectrum is obtained (see Figure 1.1). Similarly, an ‘atomic fluorescence’ spectrum would be the plot of the measured intensity (coming from atoms excited by appropriate electromagnetic radiation) as a function of the frequency of the emitted radiation. Finally, if stimulated absorption of light in response to an electronic transition between a lower and a higher energy level is measured, a plot of ‘percent absorption versus frequency of the light’ can be drawn; such a plot represents an ‘atomic absorption’ spectrum.
The atomic lines in the spectrum appear as vertical lines or ‘peaks’ due to the nature of the electronic transition involved. That is, in molecules an electronic transition is usually accompanied by simultaneous changes in the molecule’s vibrational and rotational energy levels; sometimes all the three energy types may change simultaneously in an electronic transition in a molecule. The many different transition possibilities allowed in this way and the solvent effect derived from the aggregation state of the sample (the ‘excited’ sample is in liquid form) determines that in UV-Vis molecular absorption (or emission) the corresponding ‘peaks’ in the spectrum are widely broadened. Typically, the half-bandwidth of an absorption ‘band’ in such molecular UV-Vis spectra is around 40 nm (or 400 Å), whereas in atomic ‘lines’ the half-bandwidth observed as a result of pure electronic transitions is of a few hundredths of an angström (typically 0.03–0.05 Å).
Thus, spectral interferences are less likely in atomic spectroscopy than in molecular spectroscopy analysis. In any case, even the atomic ‘lines’ are not completely ‘monochromatic’ (i.e. only one wavelength per transition). In fact, there are several phenomena which bring about ‘broadening’. Therefore, any atomic line shows a ‘profile’ (distribution of intensities) as a function of wavelength (or frequency). The analytical selectivity is conditioned by the overall broadening of the lines (particularly the form of the wings of such atomic lines).
The selection of the most appropriate atomic line among all possible transitions for qualitative and quantitative purposes is critical. For most elements, the ‘resonance’ atomic lines (i.e. when the lowest energy level in the corresponding transition is the fundamental or ‘ground state’ level, E0 = 0) are the most sensitive ones in flames, and they are used in the majority of flame methods. However, with plasma sources (commonly used in combination with OES), the choice is more difficult because several emission lines from neutral atoms or atomic ions of the same element may appear usefu...
Table of contents
- Cover image
- Title page
- Copyright
- Preface
- Structure of the Book
- Contents
- List of Contributors
- Chapter 1 An Overview of Atomic Spectrometric Techniques
- Chapter 2 Classical Linear Regression by the Least Squares Method
- Chapter 3 Implementing a Robust Methodology: Experimental Designs and Optimisation
- Chapter 4 Ordinary Multiple Linear Regression and Principal Components Regression
- Chapter 5 Partial Least-Squares Regression
- Chapter 6 Multivariate Regression using Artificial Neural Networks and Support Vector Machines
- Subject Index
Frequently asked questions
Yes, you can cancel anytime from the Subscription tab in your account settings on the Perlego website. Your subscription will stay active until the end of your current billing period. Learn how to cancel your subscription
No, books cannot be downloaded as external files, such as PDFs, for use outside of Perlego. However, you can download books within the Perlego app for offline reading on mobile or tablet. Learn how to download books offline
Perlego offers two plans: Essential and Complete
- Essential is ideal for learners and professionals who enjoy exploring a wide range of subjects. Access the Essential Library with 800,000+ trusted titles and best-sellers across business, personal growth, and the humanities. Includes unlimited reading time and Standard Read Aloud voice.
- Complete: Perfect for advanced learners and researchers needing full, unrestricted access. Unlock 1.5M+ books across hundreds of subjects, including academic and specialized titles. The Complete Plan also includes advanced features like Premium Read Aloud and Research Assistant.
We are an online textbook subscription service, where you can get access to an entire online library for less than the price of a single book per month. With over 1.5 million books across 990+ topics, we’ve got you covered! Learn about our mission
Look out for the read-aloud symbol on your next book to see if you can listen to it. The read-aloud tool reads text aloud for you, highlighting the text as it is being read. You can pause it, speed it up and slow it down. Learn more about Read Aloud
Yes! You can use the Perlego app on both iOS and Android devices to read anytime, anywhere — even offline. Perfect for commutes or when you’re on the go.
Please note we cannot support devices running on iOS 13 and Android 7 or earlier. Learn more about using the app
Please note we cannot support devices running on iOS 13 and Android 7 or earlier. Learn more about using the app
Yes, you can access Basic Chemometric Techniques in Atomic Spectroscopy by Jose Andrade-Garda in PDF and/or ePUB format, as well as other popular books in Physical Sciences & Astronomy & Astrophysics. We have over 1.5 million books available in our catalogue for you to explore.