Providing an updated summary of the application of different types of sensors for the analysis of food safety and quality, this book discusses the core principles, current research status, challenges and successful examples for each technology. In addition, the prospective and future trends for each topic are covered in each chapter. The editor and contributors are all experts in designing and constructing different types of sensors in food analysis, mainly focusing on the determination of food safety and quality.
Sensors, as a new generation of detection technique, have many advantages and the application of sensors in food analysis will continue to grow in the next decades. However, until now, there has been no book providing the detailed characterization and summary of sensors in food safety and quality analysis that this book provides. It is vital reading for academic researchers and practising professionals in Food Science, Agricultural Engineering, Biological Systems Engineering, Food Safety, Food Quality and Food Analysis who are using sensors in their work.

- 382 pages
- English
- ePUB (mobile friendly)
- Available on iOS & Android
eBook - ePub
Sensing Techniques for Food Safety and Quality Control
About this book
Trusted by 375,005 students
Access to over 1.5 million titles for a fair monthly price.
Study more efficiently using our study tools.
Information
CHAPTER 1
Raman Spectroscopic Sensing in Food Safety and Quality Analysis
Department of Food Science and TechnologyUniversity of Nebraska-Lincoln1901 21st StreetLincolnNE 68588USA[email protected]
1.1 Raman spectroscopy
1.1.1 Basics of Raman Spectroscopy
Photons, which make up light, may interact with a molecule when the incident light is directed onto the molecule. The photons could be adsorbed by the molecule, if the photon energy matches the energy gap between the ground state and the excited state of the molecule. The molecule is promoted to a higher energy excited state after the adsorption of photon energy.1,2
On the other hand, if the photon energy does not match the differences between two energy levels of a molecule, the photon can also interact with the molecule and be scattered from it.3 For example, when a single frequency of light is used to irradiate samples, the photons interact with the molecules and polarize the electron clouds near the nuclei to form a virtual state for this molecule. The lifetime of this virtual state is very short, leading to the re-radiation of the photons. When the energy of a re-radiated photon is equal to the energy of an incident photon, the scattering is called “Rayleigh scattering”, which is the dominant scattering and does not involve any energy transfer. When the molecule in the ground state is promoted to the virtual state and then returns to the excited state, the scattering is called “Stokes scattering”. This process involves energy transfer from photons to the molecule.1 Likewise, when a molecule in the excited state is promoted to the virtual state and then returns to the ground state, the scattering is called “anti-Stokes scattering”. This scattering process transfers the energy from the molecule to photons. Raman scattering is the inelastic scattering of a photon, including both Stokes and anti-Stokes scattering. However, Raman spectroscopy usually records Stokes scattering because anti-Stokes scattering is very weak compared to Stokes scattering. For example, Coherent Anti-Stokes Raman Spectroscopy (CARS) collects anti-Stokes Raman scattering. Due to the weak scattering intensity, it has not been widely used for routine analysis (Figure 1.1).
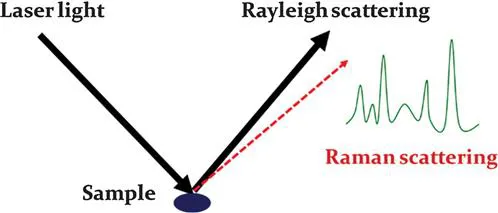
Figure 1.1 Generation of Raman scattering and a typical Raman spectrum.
By recording the Raman scattering and calculating the energy loss of incident photons, Raman spectroscopy provides detailed vibrational information for the molecules in a sample.4 The Raman spectra are like “fingerprints” to the molecules, which are very useful for the identification of molecules. However, as stated above, the dominant scattering of the photon–molecule interaction is Rayleigh scattering. Raman scattering is a very weak effect. Therefore, many methods have been used to enhance the signals of Raman spectroscopy, resulting in a new term called “surface enhanced Raman spectroscopy” (SERS).
1.1.2 The Raman Spectrometer
The Raman spectrometer consists of three major components: an excitation source, a sampling apparatus and a detector. Modern Raman spectrometers use a laser as the excitation source, a spectrometer for the detector and either a microscope or a fibre-optic probe for the sampling apparatus. The laser is very important in Raman spectrometry because it directly influences the Raman response from the targeted molecules.
A laser is a device that emits light through a process of light amplification due to the stimulated emission of electromagnetic radiation. The word “laser” is an acronym for Light Amplification by Stimulated Emission of Radiation. A laser device consists of a gain medium, an energy supply and an optical cavity. The gain medium is used to amplify light by stimulated emission. The energy is usually supplied by electrical current. The optical cavity is used to amplify the light. It is made by a pair of mirrors. The light could bounce between the two mirrors and pass the gain medium, where the light is amplified each time. One of the mirrors has a small transparent area, which allows the laser to spread out and form a narrow beam. This light beam could be used for Raman spectroscopy.
Laser sources for Raman spectroscopy are divided into three categories, including ultra-violet laser, visible laser and near-infrared laser. The ultra-violet laser has a wavelength of 244 nm, 257 nm, 325 nm and 364 nm. The visible laser has a wavelength of 457 nm, 473 nm, 488 nm, 514 nm, 532 nm, 633 nm and 660 nm. The near-infrared laser has a wavelength of 785 nm, 830 nm, 980 nm and 1064 nm. For Raman spectroscopy, the most widely used lasers are the visible lasers with a wavelength of 532 and 633 nm, and the near-infrared laser with a wavelength of 785 nm.
A high-performance laser is required to obtain high-quality Raman spectra. It is also important to select a suitable excitation wavelength in order to get the best Raman response. The Raman intensity is positively proportional to λ−4, where λ represents the laser wavelength. Thus, the infrared laser (785 nm) will result in a lower Raman intensity compared to the visible laser (514 nm and 633 nm). Second, the spatial resolutions are different between different lasers. The laser spot can be calculated according to the equation that diameter=1.22 λ/NA. NA is the numerical aperture of the microscope. For example, when a 0.75/50 microscope lens is used, the laser spot has a diameter of 1.28 μm and 0.73 μm for a 785-nm laser and a 532-nm laser, respectively. Thus, the 514-nm laser has a smaller laser spot. Third, the laser performance also depends upon the target chemicals. The infrared laser (785 nm) is useful in suppressing the fluorescence for organic chemicals. The 514-nm and 633-nm lasers are useful for the resonance Raman experiments because most of the excitation wavelength of fluorescence is close to this region. Ultra-violet lasers are useful for the analysis of macromolecules, such as proteins, because the ultra-violet laser can be used to achieve the resonance for those biomolecules. Finally, when a laser is used for surface enhanced Raman spectroscopy (SERS), the laser performance depends upon the SERS substrate as well. The maximum SERS enhancement is achieved when the laser wavelength is close to the localized surface plasmon resonance (LSPR) of the substrate.
1.1.3 Surface Enhanced Raman Spectroscopy (SERS)
Surface enhanced Raman spectroscopy is a technique that can greatly enhance the Raman signals from molecules or bacteria adsorbed onto the surface of a substrate (Figure 1.2).5,6 The enhancement factor can be as high as 1010. Traditional analytical methods, such as High Performance Liquid Chromatography (HPLC), Gas Chromatography (GC) and Enzyme-Linked Immunosorbent Assay (ELISA), are time consuming and labour intensive, and often require complicated sample pre-treatment.7 The running and maintenance costs for HPLC and GC are also very high. In contrast, SERS does not require complex sample pre-treatment and expensive solvent/column for operation. Furthermore, SERS only requires a few seconds for a single measurement, which is much faster than HPLC and GC. Due to its high sensitivity, unique spectroscopic fingerprinting features and non-destructive data acquisition, the SERS technique has extensive potential to be used for the detection and identification of chemical and microbiological contaminants in foods as well as food quality analysis.8
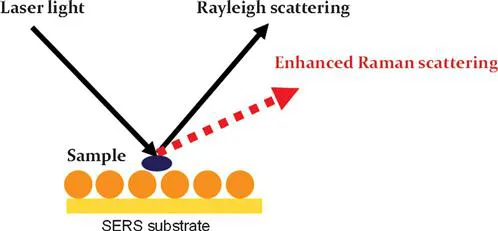
Figure 1.2 Scheme of surface enhanced Raman scattering.
1.1.4 Statistical Analysis for SERS Methods
Unlike the HPLC profile, the SERS spectrum is highly dependent upon the SERS substrates and the equipment used. The SERS spectrum often has relatively big variations compared to other analytical methods. It is highly necessary to use statistical methods to analyze the SERS spectra and interpret them accurately. The most commonly used methods are Principal Component Analysis (PCA) and Partial Least Squares (PLS).
PCA is a statistical procedure that converts a set of correlated variables into a set of linearly uncorrelated variables called “principal components”.9 The number of principal components is smaller than the number of variables. By using an appropriate orthogonal transformation, a series of principal components can be identified. The first principal component must have the largest possible variance and the second principal component has the second largest possible variance. This analogy is applied to other principal components. In other words, PCA is a transformation method. This orthogonal transformation could transform the data to a new coordinate system. In this new coordinate system, the largest variance is projected onto the first coordinate and the second largest variance is projected onto the second coordinate. The PCA technique is used to find those coordinate systems and evaluate the contribution of each component, which means that it can be used to find the major contributing peaks for a specific molecule from the complex Raman spectra.
For example, in order to comprehensively study an object, we have to include a variety of factors that have influence on the object. However, not all of the factors contribute equally to the behaviour of this object. Some factors contribute more th...
Table of contents
- Cover
- Title
- Copyright
- Preface
- Contents
- Chapter 1 Raman Spectroscopic Sensing in Food Safety and Quality Analysis
- Chapter 2 Quantum Dots in the Analysis of Food Safety and Quality
- Chapter 3 Microfluidic “Lab-on-a-Chip” Sensing in Food Safety and Quality Analysis
- Chapter 4 Paper-fluidic Based Sensing in Food Safety and Quality Analysis
- Chapter 5 Colorimetric-based Sensing in Food Safety and Quality Analysis
- Chapter 6 ELISA-based Sensing in Food Safety and Quality Analysis
- Chapter 7 Molecularly Imprinted Polymers-based Sensing in Food Safety and Quality Analysis
- Chapter 8 Aptamer-based Sensing Techniques for Food Safety and Quality
- Chapter 9 Carbon Nanotube Sensing in Food Safety and Quality Analysis
- Chapter 10 Graphene-electrochemical Sensing in Food Safety and Quality Analysis
- Chapter 11 Smartphone-based Sensing in Food Safety and Quality Analysis
- Subject Index
Frequently asked questions
Yes, you can cancel anytime from the Subscription tab in your account settings on the Perlego website. Your subscription will stay active until the end of your current billing period. Learn how to cancel your subscription
No, books cannot be downloaded as external files, such as PDFs, for use outside of Perlego. However, you can download books within the Perlego app for offline reading on mobile or tablet. Learn how to download books offline
Perlego offers two plans: Essential and Complete
- Essential is ideal for learners and professionals who enjoy exploring a wide range of subjects. Access the Essential Library with 800,000+ trusted titles and best-sellers across business, personal growth, and the humanities. Includes unlimited reading time and Standard Read Aloud voice.
- Complete: Perfect for advanced learners and researchers needing full, unrestricted access. Unlock 1.5M+ books across hundreds of subjects, including academic and specialized titles. The Complete Plan also includes advanced features like Premium Read Aloud and Research Assistant.
We are an online textbook subscription service, where you can get access to an entire online library for less than the price of a single book per month. With over 1.5 million books across 990+ topics, we’ve got you covered! Learn about our mission
Look out for the read-aloud symbol on your next book to see if you can listen to it. The read-aloud tool reads text aloud for you, highlighting the text as it is being read. You can pause it, speed it up and slow it down. Learn more about Read Aloud
Yes! You can use the Perlego app on both iOS and Android devices to read anytime, anywhere — even offline. Perfect for commutes or when you’re on the go.
Please note we cannot support devices running on iOS 13 and Android 7 or earlier. Learn more about using the app
Please note we cannot support devices running on iOS 13 and Android 7 or earlier. Learn more about using the app
Yes, you can access Sensing Techniques for Food Safety and Quality Control by Xiaonan Lu in PDF and/or ePUB format, as well as other popular books in Technology & Engineering & Analytic Chemistry. We have over 1.5 million books available in our catalogue for you to explore.