Introduction
The field of tourism and hospitality research is closely linked with the innovative implementation and use (Rasoolimanesh, Dahalan, & Jaafar, 2016; Rasoolimanesh, Jaafar, Kock, & Ahmad, 2017) of the partial least squares (PLS) technique (Kock, 2010; Kock & Hadaya, 2018). This technique has been extensively used in a variety of fields within the broader scholarly realm of business and social sciences research, a practice that has extended to many other fields over the years, to analyze path models with variables that are measured indirectly through other variables. These indirectly measured variables are generally known as latent variables (Kline, 1998; Kock & Lynn, 2012). The approach to analyzing path models with latent variables is broadly known as structural equation modeling (SEM). Thus, the acronym “PLS-SEM” is used here to refer to SEM employing PLS.
One of the most fundamental issues in PLS-SEM is that of minimum sample size estimation. A widely used minimum sample size estimation method in PLS-SEM is the “10-times rule” method (Hair, Ringle, & Sarstedt, 2011), which builds on the assumption that the sample size employed in an empirical study should be greater than 10 times the maximum number of inner or outer model links pointing at any latent variable in the model. While this method’s simplicity of application makes it a favorite among PLS-SEM users, it has been shown in the past to lead to grossly inaccurate estimates (Goodhue, Lewis, & Thompson, 2012; Kock & Hadaya, 2018).
We propose two related methods, based on mathematical equations, for minimum sample size estimation in PLS-SEM. The first method is called the inverse square root method because it uses the inverse square root of a sample’s size for standard error estimation – an important step in minimum sample size estimation. The second method is called the gamma-exponential method because it relies on gamma and exponential smoothing function corrections applied to the first method.
The application of the methods is illustrated based on a model derived from a tourism and hospitality research study. Both methods are implemented in one of the leading PLS-SEM software tools, WarpPLS, starting in version 6.0 (Kock, 2017). Informed by various Monte Carlo experiments (Kock & Hadaya, 2018), we show that both methods are fairly accurate, with the inverse square root method being also particularly attractive in terms of its simplicity of application.
Illustrative Study
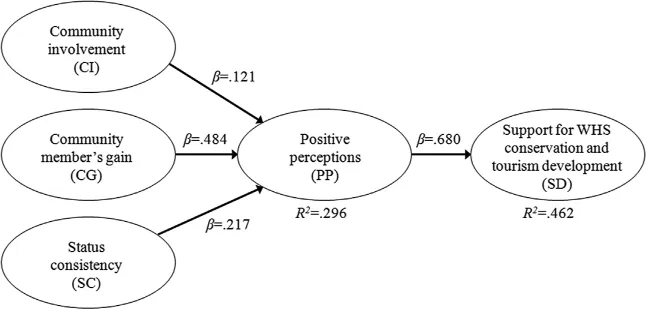
We use a study in the field of tourism and hospitality research as a basis for the development of a model to illustrate our discussion of minimum sample size estimation in PLS-SEM. Fig. 1 summarizes the results in terms of path coefficients (e.g., β = 0.121) and R2 coefficients (e.g., R2 = 0.296). The study used as a basis for the model was authored by Rasoolimanesh, Jaafar, Kock, and Ahmad, and published in the Journal of Sustainable Tourism in 2017 (Rasoolimanesh et al., 2017). A solid theoretical development underlies the study. It was published in an outlet, namely the Journal of Sustainable Tourism, which has long been considered a very selective and elite academic journal in the field of tourism and hospitality research. To simplify our discussion, our model is a modified version of the model developed and tested by Rasoolimanesh et al. (2017).
The latent variables shown as ovals are assumed to be measured reflectively through multiple indicators, primarily on Likert-type scales with multiple points (e.g., 5 points). Community involvement refers to the degree of local resident involvement in the management of a World Heritage Site (WHS). A WHS is typically a geographical area or landmark that has been formally deemed by the United Nations Educational, Scientific and Cultural Organization (UNESCO) as having major cultural, historical, or scientific significance.
Fig. 1: Illustrative Model.
Community member’s gain refers to perceived gains (e.g., in household income and quality of life) to the resident’s friends and relatives. Status consistency refers to the resident’s satisfaction and sense of belonging to the community where the WHS is located. Positive perceptions is a variable that refers to positive perceptions about the community to which the WHS belongs as arising from the WHS status granted by the UNESCO. Support for WHS conservation and tourism development refers to degree to which a resident perceives involvement in the management of a WHS as being important.
Power, Effect Size, and Minimum Sample Size
Statistical power (Cohen, 1988, 1992; Goodhue et al., 2012; Kock, 2016; Muthén & Muthén, 2002), often referred to simply as “power,” is a statistical test’s probability of avoiding type II errors, or false negatives. Power is often estimated for a particular coefficient of association and sample size, for samples drawn from a population, at a given significance level (usually, p < 0.05). For example, let us assume that a PLS-SEM test is applied to a path in a model where the corresponding coefficient is associated with a “real” effect at the population level of magnitude 0.2; which would be referred to as the “true” path coefficient. Let us also assume that the test correctly recognizes the path coefficient as significant 83% of the time when samples of size 150 are randomly taken from the population. Under these circumstances, we would conclude that the power of the test is 83%, or 0.83.
The effect size (Cohen, 1988, 1992; Kock, 2014b) is a measure of the magnitude of an effect that is independent of the size of the sample analyzed. Two main measures of effect size are commonly used in PLS-SEM. One is Cohen’s f2 coefficient (Cohen, 1988, 1992), which is calculated as ΔR2/(1 – R2), where ΔR2 is the incremental contribution of a predictor latent variable to the R2 of the criterion latent variable to which it points. The other measure of effect size commonly used in PLS-SEM is the absolute contribution of the predictor latent variable (Kock, 2014b; Mandal, Mukhopadhyay, Bagchi, & Gunasekaran, 2012), namely the numerator ΔR2 of Cohen’s f2 equation, without the denominator correction. This second measure tends to yield lower results, thus being a more conservative effect size estimate. By convention, effect sizes of 0.02, 0.15, and 0.35 are, respectively, termed small, medium, and large (Cohen, 1992; Kock, 2014b).
The minimum sample size at which a PLS-SEM test achieves an acceptable level of power (usually 0.8) depends on the effect size associated with the path coefficient under consideration (Cohen, 1988, 1992; Goodhue et al., 2012; Kock, 2014b). The higher is the magnitude of a path coefficient at the population level, the higher is usually its effect size, and the greater is the probability that a true effect will be properly detected with a small sample. Therefore, strong path coefficients at the population level, whether they are negative or positive, tend to require very small sample sizes for their proper identification. So, if a researcher knows that all of the path coefficients of a model will be strong prior to collecting empirical data, leading to large effect sizes, the researcher may consider using a small sample size in a PLS-SEM analysis. As we will see later, we can use the notion of effect size for a general minimum sample size recommendation that does not rely on predictions about path strength.
More often than not, PLS-SEM is presented as being a desirable multivariate data analysis method due to its remarkable ability to achieve acceptable power at very small sample sizes (Hair et al., 2011; Hair, Hult, Ringle, & Sartedt, 2014). While this may be true for models containing only strong path coefficients and large effect sizes, it is not true for models with path coefficients of more modest magnitudes, and certainly not true for models with fairly weak path coefficients. (At points in our discussion, we deviate somewhat from strict technical statistical jargon, for simplicity. For example, in the previous sentence we refer to “weak” path coefficients, meaning positive or negative path coefficients whose absolute values are low.) As demonstrated by Kock and Hadaya (2018), PLS-SEM’s power is co...