More than a decade ago, Clayton Christensen's breakthrough book The Innovator's Dilemma illustrated how disruptive innovations drive industry transformation and market creation. Christensen's research demonstrated how growth-seeking incumbents must develop the capability to deflect disruptive attacks and seize disruptive opportunities.In The Innovator's Guide to Growth, Scott Anthony, Mark Johnson, Joseph Sinfield, and Elizabeth Altman take the subject to the next level: implementation. The authors explain how to create this crucial capability for unlocking disruption's transformational power.With a foreword by Christensen, this book provides a set of market-proven tools and approaches to innovation that have been honed through fieldwork with innovative companies like Procter & Gamble, Johnson & Johnson, Pepsi, Intel, Motorola, SAP, and Cisco Systems. The book shows you how to: Follow a market-proven process -- so your company can reliably create blockbuster businesses
Create structures, systems, and metrics -- so the disruptive innovations that will power your firm's future growth receive the funding and personnel needed to succeed
Create a common language of disruptive innovation -- so managers can reach consensus around counterintuitive courses of actionIncisive and practical, this book helps your company take the steps necessary to benefit from disruption -- instead of being eclipsed by it.

eBook - ePub
The Innovator's Guide to Growth
Putting Disruptive Innovation to Work
- 320 pages
- English
- ePUB (mobile friendly)
- Available on iOS & Android
eBook - ePub
The Innovator's Guide to Growth
Putting Disruptive Innovation to Work
About this book
Trusted by 375,005 students
Access to over 1.5 million titles for a fair monthly price.
Study more efficiently using our study tools.
Information
CHAPTER 1
Precursors to Innovation
ANY EXECUTIVE KNOWS INTUITIVELY how difficult it is to master the forces of innovation. Large sample surveys support these intuitive conclusions. Most ideas never gain traction. Companies that achieve greatness topple. Large companies that survive tend to underperform relative to the market.1 Conglomerates that seek to diversify to deliver better returns tend to be worth less than the sum of their parts.
The central argument of this book is that there are in fact practical ways to buck these trends. Companies that act appropriately can follow a different approach that allows them to create growth repeatedly.
The natural tendency for companies seeking to implement the ideas in this book is either to launch a stream of innovation initiatives immediately or to create a growth group to develop solutions. While these actions may sometimes be necessary, moving too quickly can lead to frustration and failure. Companies that are serious about creating systematic capabilities need to make sure they have the right “precursors” for their innovation efforts. This chapter suggests three critical precursors:
- Control over your existing assets
- A game plan for growth
- Mastery of the resource allocation process
There is no silver bullet for companies interested in enhancing their organization’s ability to innovate. But putting these three precursors together can give companies a much greater chance of realizing the innovation potential that exists within their firms.
1. Gain Control over Your Existing Assets
One executive we know is a senior leader in a multibillion dollar business unit within a multi-multibillion dollar company. He has successfully launched a stream of disruptive growth ventures within his business unit. The company trots him out to give advice to other business units seeking to create disruptive growth. His first piece of advice? “Don’t try to create disruptive businesses.”
The executive gives this counterintuitive piece of advice to remind his audience that the first issue the business unit should address is whether it has the “right” to innovate. His view is that an in-control core business is a necessary precursor to innovation.2 An out-of-control core will almost always—appropriately—pull time and attention away from growth efforts.
Consider Delta. As its core business sharply deteriorated in 2005, the airline folded its low-cost Song venture back into its core business and sold its growing Atlantic Southeast Airlines regional jet arm to SkyWest to raise desperately needed cash. Unfortunately, the core just wasn’t on solid enough footing to support growth initiatives.
Understanding whether your core is in control requires more than looking at raw growth rates. One good starting point is comparing your year-by-year revenue and profit growth rates with the average for your category or industry. If you aren’t performing at least as well as that average, it is a sign that your core business isn’t in control. You can’t help it if your industry is in structural decline, but you can make sure that you are managing that decline at least as well as other industry participants.
As you seek to gain control over your core business, you may also decide that you need to shed some underperforming assets. Selling specifically or trading more generally is a critical capability for growth-seeking companies. As Richard Foster notes in his 2001 book Creative Destruction, if companies want to outperform the market, they have to change at the pace of the market, without losing control of core operations. Specifically, Foster argues that companies have to develop the ability to create new growth businesses, operate existing businesses, and trade declining businesses.3
One well-known classic example of a company that had to exit one business to unleash its innovation potential is Intel. In the early 1980s, Intel was still spending billions of dollars on research and development in its dynamic random access memory (DRAM) business. However, the commodity characteristics of that business meant that it actually accounted for a trivial part of Intel’s overall profits. The key driver of Intel’s profits was microprocessors. Intel hadn’t intended this outcome to occur, but it did. Andy Grove and Gordon Moore famously “fired” themselves as CEOs of a DRAM business, and “rehired” themselves as CEOs of a microprocessor business. By exiting the DRAM business, they set the stage for two decades of phenomenal growth.4
Similarly, consider what happened to Duracell after it was acquired by leverage-buyout king Kohlberg Kravis Roberts (KKR) for $1.8 billion in 1988. KKR helped Duracell sell off underperforming divisions and consolidate production. As its core business steadied, Duracell diversified into new product lines. As a result, after years of stagnant or nonexistent growth, cash flow increased by more than 15 percent a year annually between 1989 and 1995. The company introduced many innovations, such as rechargeable batteries and battery multipacks, that allowed it to become the market leader. The company went public in 1991 and was purchased by Gillette in 1996 for $2.8 billion. Including cash flow from operations, KKR made close to a 40 percent compounded return on its investment. Foster notes, “Duracell had to destroy to create.”5
The disruptive concepts described in the following three chapters can be a helpful way to identify the specific assets that should be traded. When you see clear signs that you have other assets that can be stronger bases from which to reach nonconsumers (chapter 2), or that overshooting is about to set in or has already set in (chapter 3), or you have assets that can help customers get critical jobs done (chapter 4), consider selling off that piece of the business.
2. Build a Game Plan for Growth
Once core operations are under control, the next task is to build a game plan for growth. Creating a compelling game plan involves estimating the target results of the organization’s innovation efforts, defining a target innovation portfolio, developing a “train schedule” for innovation, determining goals and boundaries for innovation, and identifying growth domains.
Calculating the Growth Gap
It’s hard to create a game plan if you don’t know what a winning outcome looks like. Companies need to start by fully understanding the gap between their organization’s growth aspirations and their innovation pipeline.
First, articulate the desired outcome of your innovation efforts and where you expect to find growth. Broadly speaking, growth comes from organic efforts or acquisitions that expand the core business, moves into adjacent markets, or initiates to create entirely new businesses. Companies should have a rough estimate of their financial targets and how much growth they expect to see from each of these categories.
Next, approximate from the bottom up how much potential is in your innovation pipeline in each of your categories. After completing the analysis, check the gap between where you hope to be and where you will be according to your current projections. Be sure to risk-adjust the projections of uncertain growth strategies.
Calculating a growth gap is no easy task (see tool 1-1 for some pointers). It requires making a multitude of assumptions, many of which are sure to be wrong. However, even directional findings from the exercise can be telling. One immediate warning sign: defining success as requiring every innovation project to meet or exceed its current projections.
Consider the experience of a large consumer products company. The company spent about a month developing detailed estimates of how much growth it could expect from its core business and products in its development pipeline. It was shocked to learn that—even in the most optimistic scenarios—it still had to come up with almost an additional billion dollars in new growth to meet its ten-year strategic targets. Before the exercise, senior executives had sensed that innovation was important. After the exercise, innovation became the number one item on the corporate agenda. The insight helped magnify the company’s innovation challenge and rally key managers around the need to approach innovation differently.
TOOL 1-1
Application exercise: Calculate your growth gap
| Instructions |
| Current revenues: Revenues for the current fiscal year. |
| Five-year growth rate: Projected annual growth rate for existing operations (not including adjacent moves and new initiatives). |
| Projected year 5 core revenues: Current revenues x (1 + growth rate) ^ 5. |
| Targeted adjacencies: Description of new customers, regions, or channels that extend the core business. |
| Projected year 5 adjacent revenues: Expected revenues from adjacent moves. |
| Number launched this year: Estimated number of new growth initiatives launched in a given year. |
| Year 5 revenues/initiative: Average expected revenue generated by initiatives launched in a given year in year 5 (e.g., the third year of revenues for initiatives launched in year 2). |
| Projected success rate: The expected success rate of initiatives launched in a particular year. |
| Projected year 5 new growth revenues: Number launched x revenue / initiative x success rate. |
| Target year 5 revenues: The strategic target for revenues in year 5. |
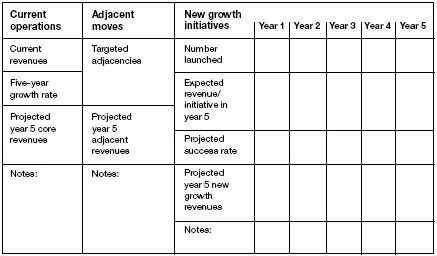 |
| Target year 5 revenues______ |
| Projected year 5 revenues______ |
| Growth gap______ |
Note: This and several other tools appearing in this book are available at www.innosight.com/resources.
Advanced analytical techniques that lead to a distribution of potential outcomes can help provide deeper insight into the growth gap. For example, one $5 billion company created several “doomsday” scenarios that described negative future states. It developed a consensus among senior managers about what could happen to key economic variables in each scenario. It then used Crystal Ball simulation software to run thousands of scenarios, with each of those drivers changing randomly according to a predefined set of parameters. The analysis led the company to believe that there was a reasonable chance that it could be staring at a gap of $500 million in earnings (representing 20 percent of earnings) in five years. Of course, the projections could have been wrong, but the chances that the gap would be significant helped motivate the company’s leaders to take action. As a side note, the company discovered that one benefit of this approach is that it is much easier to align people around the possible outcomes for a particular variable than to gain consensus on the most likely outcome for that variable, or to ask people to sign their name to a precise answer. Once senior leaders agree on the inputs into the simulation model, the results are just math. It seems simple, but this approach can help management teams escape groupthink and see a growth gap with greater clarity.
Mapping Out a Balanced Innovation Portfolio
The growth gap analysis often identifies an out-of-balance innovation portfolio. All good investors know the value of aligning their portfolios with their investment objectives. If you want to pursue an aggressive growth strategy, you might allocate 50 percent of your funds to stocks in small and medium-size companies, 40 percent to large companies, and 10 percent to bonds. In any given year, the portfolio could lose money, but in the long run it should produce strong growth. If you want to take less risk, your portfolio might contain 50 percent stocks in large companies, 30 percent bonds, and 20 percent cash. Although your upside might be lower, the odds that you will lose money in any given year will be lower too.
Companies should similarly think carefully about the mix of projects they pick to satisfy their growth objectives. Organizations that scrutinize their innovation portfolio often find that their investment allocation doesn’t match their intended strategy. Frequently, the great majority of their investment lands in close-to-the core, incremental improvements with a single, highly risky initiative that has a large chance of failure. While this portfolio might seem “safe,” portfolio theory suggests that increasing diversity is a crucial way...
Table of contents
- Cover
- Copyright
- FOREWORD Reflections on Disruption
- ACKNOWLEDGMENTS
- INTRODUCTION
- CHAPTER 1: Precursors to Innovation
- PART ONE: Identify Opportunities
- PART TWO: Formulate and Shape Ideas
- PART THREE: Build the Business
- PART FOUR: Build Capabilities
- APPENDIX
- NOTES
- ABOUT THE AUTHORS
Frequently asked questions
Yes, you can cancel anytime from the Subscription tab in your account settings on the Perlego website. Your subscription will stay active until the end of your current billing period. Learn how to cancel your subscription
No, books cannot be downloaded as external files, such as PDFs, for use outside of Perlego. However, you can download books within the Perlego app for offline reading on mobile or tablet. Learn how to download books offline
Perlego offers two plans: Essential and Complete
- Essential is ideal for learners and professionals who enjoy exploring a wide range of subjects. Access the Essential Library with 800,000+ trusted titles and best-sellers across business, personal growth, and the humanities. Includes unlimited reading time and Standard Read Aloud voice.
- Complete: Perfect for advanced learners and researchers needing full, unrestricted access. Unlock 1.5M+ books across hundreds of subjects, including academic and specialized titles. The Complete Plan also includes advanced features like Premium Read Aloud and Research Assistant.
We are an online textbook subscription service, where you can get access to an entire online library for less than the price of a single book per month. With over 1.5 million books across 990+ topics, we’ve got you covered! Learn about our mission
Look out for the read-aloud symbol on your next book to see if you can listen to it. The read-aloud tool reads text aloud for you, highlighting the text as it is being read. You can pause it, speed it up and slow it down. Learn more about Read Aloud
Yes! You can use the Perlego app on both iOS and Android devices to read anytime, anywhere — even offline. Perfect for commutes or when you’re on the go.
Please note we cannot support devices running on iOS 13 and Android 7 or earlier. Learn more about using the app
Please note we cannot support devices running on iOS 13 and Android 7 or earlier. Learn more about using the app
Yes, you can access The Innovator's Guide to Growth by Scott D. Anthony, Mark W. Johnson, Joseph V. Sinfield, Elizabeth J. Altman in PDF and/or ePUB format, as well as other popular books in Business & Business General. We have over 1.5 million books available in our catalogue for you to explore.