![]()
1 | HIGH PERFORMANCE:
THE BUSINESS OF JUMPING S-CURVES |
FOR MANY DECADES, Zenith truly was—as its name suggests—at the top. Founded in 1918 and incorporated in 1923 as the Zenith Radio Corporation, the company introduced the world’s first portable radio in 1924. Two decades later, with the advent of television, the company successfully shifted its focus. It introduced its first black-and-white sets in 1948 and later developed the first hand-held remote control in 1956 and a new standard for color television, the Chromacolor tube, in 1969.1 By 1975, the company led the industry with a 24 percent share of the market for color televisions in the United States, 5 percent more than its nearest and only strong competitor at the time.2 Throughout this period, Zenith was known by the slogan it coined for itself back in 1927: “The quality goes in before the name goes on.”
But in the 1970s, the tide began to turn. Japanese manufacturers took an ever larger portion of U.S. television set sales, grabbing market share of 45 percent by 1976, triple its level at the beginning of the decade.
Zenith wasn’t beaten yet, however. In the 1980s, it moved into the computer business with Zenith Data Systems (eventually selling out to the French company Groupe Bull for more than $600 million), even as its attempts to maintain a profitable television operation were likened to “rearranging deck chairs on the Titanic” by one publication.3 Yet again, Zenith turned to its heritage as an innovator, this time focusing on promising—but costly—research into high-definition television (HDTV).4
It was at once too early and too late: well ahead with HDTV as a true consumer option, but too late to save its television business. The ship ultimately did go down, as longtime partner LG Electronics of South Korea acquired a 5 percent stake in 1991, which grew to 55 percent by 1995 when LG kicked in $350 million to gain control of the company—principally for its HDTV technology.5 Finally, in 1999, Zenith filed for bankruptcy and LG took over the remains.
Zenith exemplifies both the success of the high-performance business and the limits that many companies reach. It scaled the heights of success first with its radio business and then did what few companies are able to do: it made the leap to a second successful business when it moved into television. Ultimately, however, it couldn’t replicate that success yet a third time, either with computers or with HDTV.
Zenith had become a great company, twice (and may become one yet again, as LG has recently resurrected the brand with some early success). But high performance isn’t about achieving “greatness,” which is far too static a concept. It is about outperforming the competition again and again, even as the basis of competition in an industry or market changes. High-performance companies (or organizations) are those that continually repeat their success. They show the world that their first trip to the top was not an accident. These companies accomplish the difficult feat that gives rise to the title of this book: they jump the S-curve.
What exactly do we mean by S-curve? The term is widely used for a variety of reasons (for more, see “The Explanatory Power of the S-Curve”). But when we use the term, we simply mean the common pattern in which a successful business starts small with a few eager customers, grows rapidly as the masses seek out the new offering, and eventually peaks and levels off as the market matures. And when we speak of high-performance companies (or organizations), we mean those that somehow manage to climb that S-curve and then jump to a new one again and again (figure 1-1).
The Explanatory Power of the S-Curve
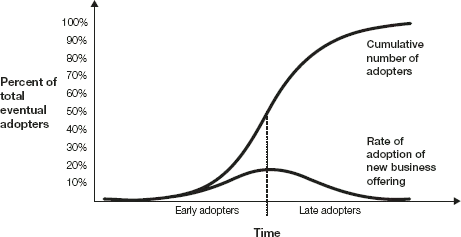
The use of the term S-curve in business circles goes back at least to the late 1800s, but it gained broader currency in the early 1960s, when Stanford University professor Everett Rogers published Diffusion of Innovations. In this book, Rogers shows how the cumulative sum of adopters of an innovation takes on the shape of the letter S. He then characterizes segments of adopters in terms that are still commonly used today. During the dot-com era, the meaning of the phenomenon was adapted to describe the rollout of the new Internet-related technologies. Best-selling books like Geoffrey Moore’s Crossing the Chasm explained how new-technology companies could break out of the bottom of the curve and reach the top.
We have found that the term S-curve can be adapted yet again to explain business performance over time. Companies thrive, after all, by successfully delivering some form of innovation to customers. Performance starts slowly as the business is launched and the company experiments to find the right business formula. Then performance accelerates rapidly as word of the attractiveness of the offering spreads, and finally it fades as the market approaches saturation, imitators appear, and obsolescence leads to better substitutes. (See figure 1-2.)
FIGURE 1-1
High performance: the climbing and jumping of S-curves
FIGURE 1-2
Diffusion of successful business offerings
After a successful new business offering is taken up by the early adopters, its rate of adoption grows rapidly before leveling off as it approaches the market saturation point.
Recognizing high performance as a series of climbs and jumps may sound intuitive, but it was not immediately obvious to us when we began our journey. A good deal of the literature on business performance at the time focused on providing a recipe for greatness—In Search of Excellence, Good to Great, and Peak Performance are a just a few of the classics in that category. Other works—books like Built to Last, Creative Destruction, and What Really Works—sought to unlock the secrets of company endurance. But a detailed, research-based analysis of the intersection of the two—how companies can achieve repeated peaks of high performance—was missing.
This was the gap that we sought to close as we took on responsibility for creating and leading the still ongoing program at Accenture to understand high performance in business—a program begun in 2003. In the near decade since, we have a learned a great deal about how companies achieve recurring greatness—which is our definition of high performance in a nutshell. For companies that want to achieve high performance, our lessons learned may sound counterintuitive: what matters most to long-term performance is not so much what you do to reach the top—though that is certainly important—but what you do to cross over to the bottom of the next S-curve and begin the climb again. Similarly, the secret to successfully jumping the S-curve is not about what you do at or near the top of the curve, but what you do to prepare for the jump on the way up. The ability of some companies to move to the bottom of the next curve, even as they climb the original one, is the focus of this book.
FINDING A PATTERN
Before we give an overview of our findings and the structure of the book, let’s cover some of the why and how of our research.
What prompted our study in the first place were the questions frequently asked by Accenture’s clients: How do we create lasting value? How do we make the transition from an existing business, which is destined to stall, to a new one? The context in which companies struggle to do this of course is familiar by now: successful companies with ever-shorter life spans on the Standard & Poor’s 500, rapid industry reinvention, near borderless competition, and shorter periods of profitability from competitive advantages that were hard-won.
Of the more than eight hundred companies that we began our study with, roughly eighty were initially judged to be high performers through a peer-based quantitative analysis that relied on 13 different financial metrics to assess each organization’s growth, profitability, consistency, longevity, and positioning for the future. (See “Separating Wheat from Chaff.”) These were companies that had both truly outperformed their peers and withstood the test of time. They had succeeded in ringing up exemplary profits, revenue growth and gains in stock performance year after year, regardless of economic or industry circumstances.
Interestingly, although we found relatively few high performers, we found considerably more than the eleven companies featured in Good to Great and the eighteen highlighted in Built to Last— high performance is within the reach of many organizations, not just the extraordinary few. If some of our high performers like Intel; PepsiCo, Inc.; and UPS were obvious, others surprised us. At the time of our initial study, companies like Danaher, Illinois Tool Works, and Reckitt Benckiser were well regarded, but their real achievements in creating the essentials of high performance were not yet well publicized.
And what did this group have in common? At that point, we weren’t sure. To find out, we conducted months of additional research, using techniques that included everything from in-depth executive surveys to multivariate regression analyses. In Accenture’s industry practice areas, special teams were created; they were staffed with experienced consultants, internal and external industry experts, practitioners and professional researchers, including a number of academics. These teams then conducted studies to identify the drivers of sustained outperformance in the peer set of their expertise. And we had our own team integrate those peer-set insights into a cohesive set of findings, which are summarized in this book.
Separating Wheat from Chaff
We set out with a very practical goal in mind. We wanted to study high performance in such a way that the findings would be helpful to practitioners, those who wake up every day to the challenges of running a business—managing existing operations while finding new markets to exploit.
Because we wanted only practical insights, we were less concerned about whether the companies we studied had always been, or would always be, high performers. It was enough that they had weathered the storms of their industry long enough and well enough to have successfully competed in multiple eras of competition. Some of the companies we highlight in this book have endured severe challenges in the past couple of years, and their status as high performers may seem in question as a result. But the label of high performer is not a promise of future performance; it is a recognition of past success so unusual (by statistical measures) that it warranted our careful study.
Likewise, relatively new entrants to the pantheon of business performance may seem conspicuous by their absence. New high performers are continually emerging, with many coming from rapidly maturing emerging markets, which is why we point you to a Web site that will give you a continuously refreshed set of industry insights into today’s high performers (http://www.accenture.com/Global/High_Performance_Business/default.htm). But our focus remained fixed on companies that had already demonstrated an ability to jump the S-curve, and by definition, the newer superstars have not yet had to face that challenge. Nor were we interested in companies whose performance might indeed have been enviable, but whose success was not particularly noteworthy in the context of their industry because competitors had also attained similarly impressive results in the same period. Also conspicuously absent may be some top competitors from emerging markets. We were not able to judge the performance of many companies that are based in developing countries because they lacked a sufficient history of results that could be reasonably assessed and directly evaluated. That said, many if not most of the companies we studied are global entities that have been active in developing countries for decades.
Having determined what we hoped to find, our next challenge was how to conduct our study. Our basic philosophy, and the key differentiator in our approach, was that all performance is relative. While starting our research, we were shocked by the number of prominent studies of business performance that had selected their high performers after comparing them head-to-head across industries—ignoring the differences in the average profitability, maturity, and risk across those markets. Their victors had won what hardly seemed a fair fight. This led us to believe that our analysis could only be properly conducted on valid sets of peer companies. “Change the peer set, change the performance,” became our mantra as we struggled to create suitable sets for comparison.
In the end, we settled on thirty-one peer sets encompassing more than eight hundred companies for our initial study. As these groups represented more than 80 percent of the market capitalization of the Russell 3000 Index at the time, we felt they were an excellent proxy for the broader market. Since then, we have identified and studied nearly one hundred peer sets. Interestingly, after our approach garnered wider public attention, thanks to an article in Harvard Business Review in 2005, we learned that some researchers outside Accenture were adjusting their methodology as a result.a While this is gratifying to us, we fully recognize that there are no enduring, permanent classifications of peer sets or even industry segments. Such categorizations can be made only on a case-by-case basis for a particular context at a specific period of time, given how company strategies continually evolve, technologies change, and industries converge (and at times diverge).
After determining the relevant peer groupings and companies to study, we still needed to crystallize our definition of high performance. After studying nearly a score of alternative methods, including the methods popularized by leading business authors of the past thirty years, we developed a definition that sets an exacting standard:
How could we turn that definition into a useful tool for analysis? Using thirteen simple and common financial metrics, we measured performance in terms of growth, profitability, consistency, longevity, and positioning for the future—the last in order to avoid rewarding those companies that create high profits by cutting investment. In general, we applied the metrics over a ten-year span to ensure coverage across the average industry life cycle of seven years. (We allowed some variation in that time frame to account for different industries’ business and investment cycles.) Our goal was to ensure the window of analysis was sufficiently long that it encompassed multiple eras of competition in the industry, during which the basis of competition shifts. Outperforming the competition for so long demands success on multiple S-curves, as companies in the peer group must both develop and respond to new technologies and ways of competing.
Most of the business studies we reviewed used simple cutoffs to pick the peak players—arbitrary cutoffs like the top quartile or the top five companies. But with that approach, the res...