Most companies have massive amounts of data at their disposal, yet fail to utilize it in any meaningful way. But a powerful new business tool - analytics - is enabling many firms to aggressively leverage their data in key business decisions and processes, with impressive results.In their previous book, Competing on Analytics, Thomas Davenport and Jeanne Harris showed how pioneering firms were building their entire strategies around their analytical capabilities. Rather than "going with the gut" when pricing products, maintaining inventory, or hiring talent, managers in these firms use data, analysis, and systematic reasoning to make decisions that improve efficiency, risk-management, and profits.Now, in Analytics at Work, Davenport, Harris, and coauthor Robert Morison reveal how any manager can effectively deploy analytics in day-to-day operations—one business decision at a time. They show how many types of analytical tools, from statistical analysis to qualitative measures like systematic behavior coding, can improve decisions about everything from what new product offering might interest customers to whether marketing dollars are being most effectively deployed.Based on all-new research and illustrated with examples from companies including Humana, Best Buy, Progressive Insurance, and Hotels.com, this implementation-focused guide outlines the five-step DELTA model for deploying and succeeding with analytical initiatives. You'll learn how to:· Use data more effectively and glean valuable analytical insights
· Manage and coordinate data, people, and technology at an enterprise level
· Understand and support what analytical leaders do
· Evaluate and choose realistic targets for analytical activity
· Recruit, hire, and manage analysts Combining the science of quantitative analysis with the art of sound reasoning, Analytics at Work provides a road map and tools for unleashing the potential buried in your company's data.
eBook - ePub
Analytics at Work
Smarter Decisions, Better Results
- 240 pages
- English
- ePUB (mobile friendly)
- Available on iOS & Android
eBook - ePub
Analytics at Work
Smarter Decisions, Better Results
About this book
Trusted by 375,005 students
Access to over 1.5 million titles for a fair monthly price.
Study more efficiently using our study tools.
Information
1
WHAT IT MEANS TO PUT
ANALYTICS TO WORK
IF WE WANT TO MAKE better decisions and take the right actions, we have to use analytics. Putting analytics to work is about improving performance in key business domains using data and analysis. For too long, managers have relied on their intuition or their “golden gut” to make decisions. For too long, important calls have been based not on data, but on the experience and unaided judgment of the decision maker. Our research suggests that 40 percent of major decisions are based not on facts, but on the manager’s gut. 1
Sometimes intuitive and experience-based decisions work out well, but often they either go astray or end in disaster: executives pursue mergers and acquisitions to palliate their egos, neglecting the sober considerations that create real value; banks make credit and risk decisions based on unexamined assumptions about always-rising asset values; governments rely on sparse intelligence before deciding whether to wage war. Such are the most extreme cases of ill-informed decision making.
In other cases, nonanalytical decisions don’t lead to tragedy, but they do leave money on the table: businesses price products and services based on their hunches about what the market will bear, not on actual data detailing what consumers have been willing to pay under similar circumstances in the past; managers hire people based on intuition, not on an analysis of the skills and personality traits that predict an employee’s high performance; supply chain managers maintain a comfortable level of inventory, rather than a data-determined optimal level; baseball scouts zoom in on players who “look the part,” not on those with the skills that—according to analytics—win games.
Socrates said, “The unexamined life isn’t worth living.” We’d argue that “the unexamined decision isn’t worth making.”
Consider this firsthand report from an executive with a software company. When asked about a recent sales seminar put on by the firm, he replied: “It went fine. We had attendees from 110 companies who received a keynote presentation designed to instill confidence in our company’s future and to encourage cross-selling, and all twelve technical sessions were well received.”
That would be enough for many companies. “I guess no decision needs to be made other than to continue holding these seminars at a pace of twelve per quarter around the country,” he reflected. But after further thought, he voiced some disquieting questions about what the sales seminar did not reveal:
• How many attendees were existing customers and how many were prospects?
• Were there attendees from every customer within the geographic area?
• Were there attendees from every prospect in the geographic area?
• Which attendees were high-growth prospects?
• How many attendees also attended the company’s annual conference?
His company simply didn’t know the answers to these questions. It had never bothered to gather and analyze the data. The executive considers his company to be more analytical than most, but, at least with regard to these seminars, it has a long way to go. As this anecdote suggests, even relatively smart and sophisticated companies are missing opportunities to put analytics to work and thereby profit from better decisions.
Companies that continue to manage on autopilot—by having sales seminars because that’s what’s always been done, for example—are not competing as effectively as they could be. In this book, we’ll provide you with a set of tools to make your organization more analytical. We’ll demonstrate that becoming more analytical is not solely the responsibility of a manager: it’s an essential concern for the entire organization.
What’s the payoff for putting analytics to work in your organization? There are many, as shown in “Some Benefits of Being Analytical.” We believe it’s no accident that the companies we cite as outstanding analytical competitors are often also outstanding performers. Analytics aren’t the only way an organization can succeed, but in most industries there are excellent illustrations that the analytical path is a viable route to success.
Some Benefits of Being Analytical
• Help manage and steer the business in turbulent times. Analytics give managers tools to understand the dynamics of their business, including how economic and marketplace shifts influence business performance.
• Know what’s really working. Rigorous analytical testing can establish whether your intervention is causing desired changes in your business, or whether it’s simply the result of random statistical fluctuations.
• Leverage previous investments in IT and information to get more insight, faster execution, and more business value in many business processes.
• Cut costs and improve efficiency. Optimization techniques can minimize asset requirements, and predictive models can anticipate market shifts and enable companies to move quickly to slash costs and eliminate waste.
• Manage risk. Greater regulatory oversight will require more precise metrics and risk management models.
• Anticipate changes in market conditions. You can detect patterns in the vast amount of customer and market data coming your way.
• Have a basis for improving decisions over time. If you are using clear logic and explicit supporting data to make a decision, you or someone else can examine the decision process more easily and try to improve it.
What Do We Mean by “Analytical”?
By analytical we mean the use of analysis, data, and systematic reasoning to make decisions. What kind of analysis? What kind of data? What kind of reasoning? There are no hard-and-fast answers; we contend that almost any analytical process can be good if provided in a serious, systematic fashion.
Many approaches to analysis are fair game, from the latest optimization techniques to tried-and-true versions of root-cause analysis. Perhaps the most common is statistical analysis, in which data are used to make inferences about a population from a sample. Variations of statistical analysis can be used for a huge variety of decisions—from knowing whether something that happened in the past was a result of your intervention, to predicting what may happen in the future. Statistical analysis can be powerful, but it’s often complex, and sometimes employs untenable assumptions about the data and the business environment.
When done correctly, statistical analyses can be both simple and valuable. You may remember from your college statistics course that “measures of central tendency”—means, medians, and modes (everybody always forgets what a mode is; it’s simply the category with the highest frequency)—are useful ways to express what’s going on in data. Sometimes analysis simply means a visual exploration of data in graphic form. You can look at a series of points on a two-dimensional graph, for example, and notice a pattern or relationship. Are there outliers in a pattern that require explanation? Are some values out of range? Visual analysis helps us to “stay close to the data” using “exploratory data analysis,” an approach that the great statistician John Tukey made respectable and Edward Tufte further popularized by helping people create clear visual representations of their data. 2
The key is to always be thinking about how to become more analytical and fact based in your decision making and to use the appropriate level of analysis for the decision at hand—and when analyses and decisions are working well, not to rest on your laurels, lest you get stuck in a decision-making rut and be unable to adapt quickly when conditions change.
Some areas of business, like environmental sustainability, haven’t historically used data or analysis, so you could become more analytical by creating simple metrics of key activities (for example, a carbon footprint), reporting them on a regular basis, and acting on the patterns that emerge. This initial step would accomplish a lot—but getting an organization to agree upon metrics in a new area is no easy task.
In other areas, such as customer behavior, you may have so much detailed data available—from a loyalty card program, say, or a Web site—that making good decisions about how to treat customers requires sophisticated analytics, including detailed segmentation, scoring customers based on their propensity to exhibit certain behaviors, and next-best-offer analysis for what customers should buy next. Producing a mere report would be seriously underachieving in this data-rich domain.
Of course, some forms of analysis don’t require quantitative data. For example, in the fields of corporate anthropology and ethnography, marketers conduct analysis by systematically observing customers while they use products or shop in stores. As Yogi Berra noted, “You can observe a lot just by watching.” The most rigorous marketers employ video and systematic behavior coding to ensure that all recorded behaviors can be analyzed later in detail. Ethnography can help companies identify problems that customers have with their products and services. Data gained through observation can also shed light on a statistical association. We may know that men with young families purchase both beer and diapers in the grocery store, but only systematic observation can reveal which they buy first, and whether it makes sense to shelve them in close proximity or at opposite ends of the store.
The most analytical firms and managers employ a combination of techniques, both quantitative and qualitative. eBay, for example, undertakes extensive and varied analyses by performing randomized tests of Web page variations before making any change to the Web site or the business model. With more than a billion page views per day, eBay can run thousands of such experiments, many concurrently. To make sense of all these tests, eBay built its own application, called the eBay Experimentation Platform, to lead testers through the process and to keep track of what’s being tested at what times on what pages. Of course, you may not feel that you can undertake the kinds of complex and detailed testing and analyses that eBay, blessed with a massive amount of data (all those mouse clicks), can support.
But in addition to online testing, eBay considers changes to its Web site using a variety of analytical approaches: the company conducts extensive, face-to-face testing with its customers, including lab studies, home visits, participatory design sessions, focus groups, and iterative trade-off analysis. eBay also conducts quantitative visual design research and eye-tracking studies, and diary studies to see how users feel about potential changes. The company will make no significant changes to its site without these analyses. This analytical orientation is not the only reason eBay is successful, but it’s clearly one factor, with 113 million items for sale in over fifty thousand categories at any given time.
It’s not our goal in this book to provide you with a list of all possible analytical tools, but rather to persuade you that putting analytics to work can help your managers and employees make better decisions, and help your organization perform better. Analytics aren’t just a way of looking at a particular problem, but rather an organizational capability that can be measured and improved. It is our goal to describe the primary components of that capability and the best ways to strengthen them. Think of this book as therapy for your organization’s analytical brain.
What Kinds of Questions Can Analytics Answer?
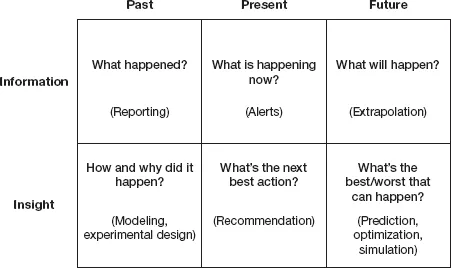
Every organization needs to answer some fundamental questions about its business. Taking an analytical approach begins with anticipating how information will be used to address common questions (see figure 1-1). These questions are organized across two dimensions:
• Time frame. Are we looking at the past, present, or future?
• Innovation. Are we working with known information or gaining new insight?
The matrix in figure 1-1 identifies the six key questions that data and analytics can address in organizations. The first set of challenges is using information more effectively. The “past” information cell is the realm of traditional business reporting, rather than analytics. By applying rules of thumb, you can generate alerts about the present—what’s happening right now (like whenever an activity strays outside of its normal performance pattern). Using simple extrapolation of past patterns creates information about the future, such as forecasts. All of these questions are useful to answer, but they don’t tell you why something happens or how likely it is to recur.
The second set of questions requires different tools to dig deeper and produce new insights. Insight into the past is gained by statistical modeling activities, which explain how and why things happened. Insight into the present takes the form of recommendations about what to do right now—for example, what additional product offering might interest a customer. Insight into the future comes from prediction, optimization, and simulation techniques to create the best possible future results.
FIGURE 1-1
Key questions addressed by analytics
Together these questions encompass much of what an organization needs to know about itself. The matrix can also be used to challenge existing uses of information. You may find, for example, that many of your “business intelligence” activities are in the top row. Moving from purely information-oriented questions to those involving insights is likely to give you a much better understanding of the dynamics of your business operations.
Analytics for the Rest of Us
In our...
Table of contents
- Cover
- Copyright
- Preface
- Acknowledgments
- 1: What It Means to Put Analytics to Work
- PART ONE: The Analytical DELTA
- PART TWO: Staying Analytical
- Appendix: The DELTA Transitions
- Notes
- About the Authors
- Also by the Author
Frequently asked questions
Yes, you can cancel anytime from the Subscription tab in your account settings on the Perlego website. Your subscription will stay active until the end of your current billing period. Learn how to cancel your subscription
No, books cannot be downloaded as external files, such as PDFs, for use outside of Perlego. However, you can download books within the Perlego app for offline reading on mobile or tablet. Learn how to download books offline
Perlego offers two plans: Essential and Complete
- Essential is ideal for learners and professionals who enjoy exploring a wide range of subjects. Access the Essential Library with 800,000+ trusted titles and best-sellers across business, personal growth, and the humanities. Includes unlimited reading time and Standard Read Aloud voice.
- Complete: Perfect for advanced learners and researchers needing full, unrestricted access. Unlock 1.5M+ books across hundreds of subjects, including academic and specialized titles. The Complete Plan also includes advanced features like Premium Read Aloud and Research Assistant.
We are an online textbook subscription service, where you can get access to an entire online library for less than the price of a single book per month. With over 1.5 million books across 990+ topics, we’ve got you covered! Learn about our mission
Look out for the read-aloud symbol on your next book to see if you can listen to it. The read-aloud tool reads text aloud for you, highlighting the text as it is being read. You can pause it, speed it up and slow it down. Learn more about Read Aloud
Yes! You can use the Perlego app on both iOS and Android devices to read anytime, anywhere — even offline. Perfect for commutes or when you’re on the go.
Please note we cannot support devices running on iOS 13 and Android 7 or earlier. Learn more about using the app
Please note we cannot support devices running on iOS 13 and Android 7 or earlier. Learn more about using the app
Yes, you can access Analytics at Work by Thomas H. Davenport, Jeanne G. Harris, Robert Morison in PDF and/or ePUB format, as well as other popular books in Business & Management. We have over 1.5 million books available in our catalogue for you to explore.