![]()
SECTION THREE
Analyze the Data
![]()
CHAPTER 9
A Predictive Analytics Primer
by Thomas H. Davenport
No one has the ability to capture and analyze data from the future. However, there is a way to predict the future using data from the past. It’s called predictive analytics, and organizations do it every day.
Has your company, for example, developed a customer lifetime value (CLTV) measure? That’s using predictive analytics to determine how much a customer will buy from the company over time. Do you have a “next best offer” or product recommendation capability? That’s an analytical prediction of the product or service that your customer is most likely to buy next. Have you made a forecast of next quarter’s sales? Used digital marketing models to determine what ad to place on what publisher’s site? All of these are forms of predictive analytics.
Predictive analytics are gaining in popularity, but what do you really need to know in order to interpret results and make better decisions? By understanding a few basics, you will feel more comfortable working with and communicating with others in your organization about the results and recommendations from predictive analytics. The quantitative analysis isn’t magic—but it is normally done with a lot of past data, a little statistical wizardry, and some important assumptions.
The Data
Lack of good data is the most common barrier to organizations seeking to employ predictive analytics. To make predictions about what customers will buy in the future, for example, you need to have good data on what they are buying (which may require a loyalty program, or at least a lot of analysis of their credit cards), what they have bought in the past, the attributes of those products (attribute-based predictions are often more accurate than the “people who buy this also buy this” type of model), and perhaps some demographic attributes of the customer (age, gender, residential location, socioeconomic status, etc.). If you have multiple channels or customer touchpoints, you need to make sure that they capture data on customer purchases in the same way your previous channels did.
All in all, it’s a fairly tough job to create a single customer data warehouse with unique customer IDs on everyone, and all past purchases customers have made through all channels. If you’ve already done that, you’ve got an incredible asset for predictive customer analytics.
The Statistics
Regression analysis in its various forms is the primary tool that organizations use for predictive analytics. It works like this, in general: An analyst hypothesizes that a set of independent variables (say, gender, income, visits to a website) are statistically correlated with the purchase of a product for a sample of customers. The analyst performs a regression analysis to see just how correlated each variable is; this usually requires some iteration to find the right combination of variables and the best model. Let’s say that the analyst succeeds and finds that each variable in the model is important in explaining the product purchase, and together the variables explain a lot of variation in the product’s sales. Using that regression equation, the analyst can then use the regression coefficients—the degree to which each variable affects the purchase behavior—to create a score predicting the likelihood of the purchase.
Voilà! You have created a predictive model for other customers who weren’t in the sample. All you have to do is compute their score and offer them the product if their score exceeds a certain level. It’s quite likely that the high-scoring customers will want to buy the product—assuming the analyst did the statistical work well and that the data was of good quality. (For more on regression analysis, read on to the next chapter.)
The Assumptions
Another key factor in any predictive model is the assumptions that underlie it. Every model has them, and it’s important to know what they are and monitor whether they are still true. The big assumption in predictive analytics is that the future will continue to be like the past. As Charles Duhigg describes in his book The Power of Habit, people establish strong patterns of behavior that they usually keep up over time. Sometimes, however, they change those behaviors, and the models that were used to predict them may no longer be valid.
What makes assumptions invalid? The most common reason is time. If your model was created several years ago, it may no longer accurately predict current behavior. The greater the elapsed time, the more likely it is that customer behavior has changed. Some Netflix predictive models, for example, that were created on early internet users had to be retired because later inter net users were substantially different. The pioneers were more technically focused and relatively young; later users were essentially everyone.
Another reason a predictive model’s assumptions may no longer be valid is if the analyst didn’t include a key variable in the model, and that variable has changed substantially over time. The great—and scary—example here is the financial crisis of 2008–2009, caused largely by invalid models predicting how likely mortgage customers were to repay their loans. The models didn’t include the possibility that housing prices might stop rising, and that they even might fall. When they did start falling, it turned out that the models were poor predictors of mortgage repayment. In essence, the belief that housing prices would always rise was a hidden assumption in the models.
Since faulty or obsolete assumptions can clearly bring down whole banks and even (nearly!) whole economies, it’s pretty important that they be carefully examined. Managers should always ask analysts what the key assumptions are, and what would have to happen for them to no longer be valid. And both managers and analysts should continually monitor the world to see if key factors involved in assumptions have changed over time.
With these fundamentals in mind, here are a few good questions to ask your analysts:
- Can you tell me something about the source of the data you used in your analysis?
- Are you sure the sample data is representative of the population?
- Are there any outliers in your data distribution? How did they affect the results?
- What assumptions are behind your analysis?
- Are there any conditions that would make your assumptions invalid?
Even with those cautions, it’s still pretty amazing that we can use analytics to predict the future. All we have to do is gather the right data, do the right type of statistical model, and be careful of our assumptions. Analytical predictions may be harder to generate than those by the late-night television soothsayer Carnac the Magnificent, but they are usually considerably more accurate.
__________
Thomas H. Davenport is the President’s Distinguished Professor in Management and Information Technology at Babson College, a research fellow at the MIT Initiative on the Digital Economy, and a senior adviser at Deloitte Analytics. Author of over a dozen management books, his latest is Only Humans Need Apply: Winners and Losers in the Age of Smart Machines.
Adapted from content posted on hbr.org, September 2, 2014 (product #H00YO1).
![]()
CHAPTER 10
Understanding Regression Analysis
by Amy Gallo
One of the most important types of data analysis is regression. It is a common approach used to draw conclusions from and make predictions based on data, but for those without a statistical or analytical background, it can also be complex and confusing.
To better understand this method and how companies use it, I talked with Thomas Redman, author of Data Driven: Profiting from Your Most Important Business Asset. He also advises organizations on their data and data quality programs.
What Is Regression Analysis?
Redman offers this example scenario: Suppose you’re a sales manager trying to predict next month’s numbers. You know that dozens, perhaps even hundreds, of factors from the weather to a competitor’s promotion to the rumor of a new and improved model can impact the number. Perhaps people in your organization even have a theory about what will have the biggest effect on sales. “Trust me. The more rain we have, the more we sell.” “Six weeks after the competitor’s promotion, sales jump.”
Regression analysis is a way of mathematically sorting out which of those variables do indeed have an impact. It answers the questions: Which factors matter most? Which can we ignore? How do those factors interact with one another? And, perhaps most importantly, how certain are we about all of these factors?
In regression analysis, those factors are called variables. You have your dependent variable—the main factor that you’re trying to understand or predict. In Redman’s example above, the dependent variable is monthly sales. And then you have your independent variables—the factors you suspect have an impact on your dependent variable.
How Does It Work?
In order to conduct a regression analysis, you gather data on the variables in question. You take all of your monthly sales numbers for, say, the past three years and any data on the independent variables you’re interested in. So, in this case, let’s say you find out the average monthly rainfall for the past three years as well. Then you plot all of that information on a chart that looks like figure 10-1.
The y-axis is the amount of sales (the dependent variable, the thing you’re interested in, is always on the y-axis) and the x-axis is the total rainfall. Each dot represents one month’s data—how much it rained that month and how many sales you made that same month.
Glancing at this data, you probably notice that sales are higher on days when it rains a lot. That’s interesting to know, but by how much? If it rains three inches, do you know how much you’ll sell? What about if it rains four inches?
FIGURE 10-1
Is there a relationship between these two variables?
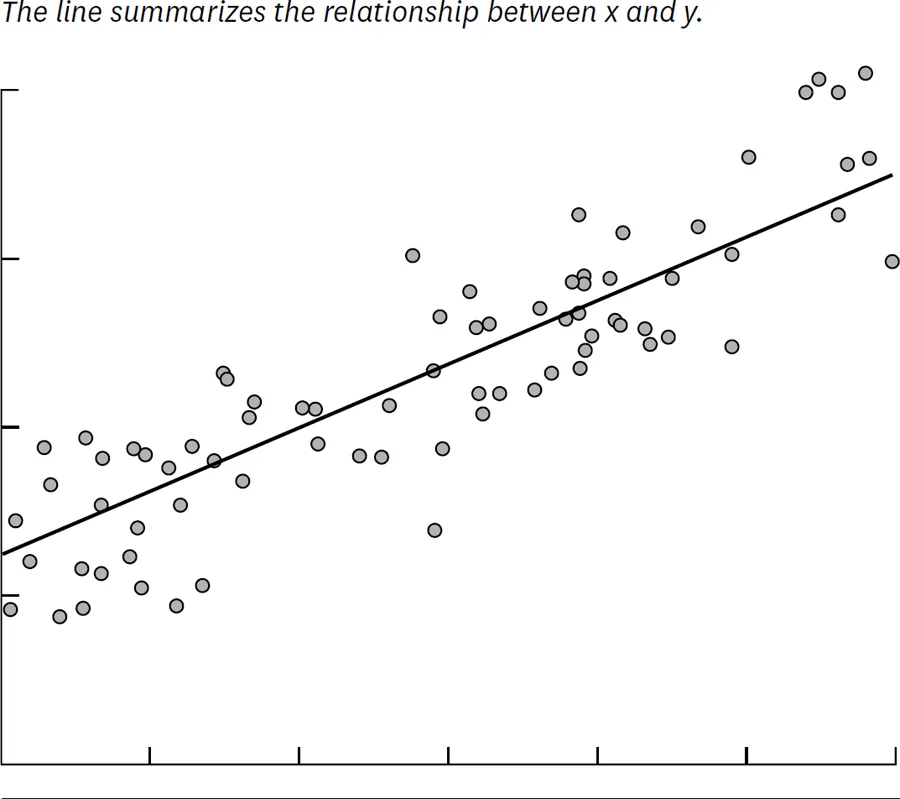
FIGURE 10-2
Building a regression model
Now imagine drawing a line through the chart, one that runs roughly through the middle of all the...