This foundational text for understanding housing, housing design, homeownership, housing policy, special topics in housing, and housing in a global context has been comprehensively revised to reflect the changed housing situation in the United States during and after the Great Recession and its subsequent movements toward recovery. The book focuses on the complexities of housing and housing-related issues, engendering an understanding of housing, its relationship to national economic factors, and housing policies. It comprises individual chapters written by housing experts who have specialization within the discipline or field, offering commentary on the physical, social, psychological, economic, and policy issues that affect the current housing landscape in the United States and abroad, while proposing solutions to its challenges.
eBook - ePub
Introduction to Housing
- 496 pages
- English
- ePUB (mobile friendly)
- Available on iOS & Android
eBook - ePub
Introduction to Housing
About this book
Trusted by 375,005 students
Access to over 1.5 million titles for a fair monthly price.
Study more efficiently using our study tools.
Information
SECTION V
SPECIAL TOPICS IN HOUSING
Chapter 16 Housing and Racial and Ethnic Diversity
Over the next few decades, the United States will gradually become a society in which non-Hispanic whites will be in the minority and people of color will be in the majority. Whereas 61.75 percent of the total resident population in the United States (of one race only) was non-Hispanic white in 2015, only 42.58 percent is projected to fall into this category in 2060 (Frey, 2013). In the near and distant future the proportion of people of color will increase (Frey, 2015). In other words, the United States will become a “majority-minority” nation in a few decades, although Texas, New Mexico, and California are already “majority-minority” states (Frey, 2013). Figure 16.1 illustrates these developments.
The increase in the proportion of people of color can be attributed to several developments. One is the relatively high fertility rates of Hispanics/Latinos (Frey, 2015; Monger & Yankay, 2014; Passel, Livingston, & Cohn, 2012). Another is the increase in the proportion of people of two or more races due to the increase in racial and ethnic intermarriage rates (Frey, 2015; U.S. Bureau of the Census, 2012; Wang, 2012). A further reason is the somewhat high immigration rates of Hispanics/Latinos and Asians (Frey, 2015; Passel et al., 2012). Finally, the number of deaths among non-Hispanic whites is higher than those among any other racial and ethnic group (Frey, 2013, 2015).
In 2011, 50.4 percent of the nation’s population younger than age one was of color (Passel et al., 2012). In two to three decades the vast majority of these very young people will form households, which typically occurs when people are in their twenties and thirties (Paciorek, 2013; see chapters 1, 2, and 9). Thus the majority of newly formed households will be of color (Joint Center for Housing Studies of Harvard University, 2014). The majority of these newly formed households will begin as renters, and some will eventually become homeowners (see chapters 7 and 9). This chapter discusses housing in the context of racial and ethnic diversity for renters and homeowners in the United States. Macroeconomic, public policy, and individual factors that influence homeownership will also be discussed in greater detail.

FIGURE 16.1
Proportion Distribution of the Projected Population by Race and Ethnicity, United States, 2015–60
Proportion Distribution of the Projected Population by Race and Ethnicity, United States, 2015–60
Source: U.S. Bureau of Census, 2012.
RENTERS IN THE UNITED STATES BY RACE AND ETHNICITY
Many consider the United States to be a nation of homeowners (Editors of New Strategist Publications, 2011). This statement is probably most fitting for many non-Hispanic whites, since they have a relatively high homeownership rate (see chapter 7). This statement is less fitting for many blacks/African Americans or Hispanics/Latinos, however, since those groups have a relatively low homeownership rate (see chapter 9).
Many policy makers are concerned with the relatively high housing cost burden of many renters, who have lower household incomes and lower wealth compared to most homeowners (Joint Center for Housing Studies of Harvard University, 2014). Renters of color tend to have lower household incomes and lower wealth compared to renters as a whole (Joint Center for Housing Studies of Harvard University, 2014; see chapter 10).
A moderate rental housing cost burden (having rental housing costs higher than 30 percent of a renter’s pretax [Schwartz, 2015] or adjusted [Pelletiere, 2008] income) might result in overcrowding, doubling up, or difficulties meeting expenses related to food, transportation, education, and health care, among other expenses, or saving for retirement. A severe rental housing cost burden (having rental housing costs higher than 50 percent of a renter’s income) might also potentially result in eviction and eventual homelessness (Joint Center for Housing Studies of Harvard University, 2013; Schwartz and Wilson, n.d.). Many low-income renters affected by a moderate or severe rental housing burden are unable to draw from resources such as a savings account or a support network that is able and willing to provide sustained financial assistance in the mid- and long run (Bratt, 2006; Joint Center for Housing Studies of Harvard University, 2012, 2013; Tilly, 2006). Table 16.1 illustrates the proportions of renters with no, moderate, and severe housing cost burdens by race and ethnicity. This table shows that the proportion of renters who face severe housing cost burdens has increased from 2001 to 2011 for each racial and ethnic group but in particular for blacks/African Americans and Hispanics/Latinos (see chapter 10).
TABLE 16.1
Proportions of Renters with No, Moderate, and Severe Housing Cost Burdens by Race and Ethnicity, 2001, 2007, and 2011
Proportions of Renters with No, Moderate, and Severe Housing Cost Burdens by Race and Ethnicity, 2001, 2007, and 2011

HOMEOWNERS IN THE UNITED STATES BY RACE AND ETHNICITY
Homeownership has been associated with higher social status since the beginning of the history of the United States. In the distant past only male, non-Hispanic white landowners could vote (Quercia, Freeman, & Ratcliffe, 2011). Currently many consider homeownership an indicator of economic and social stability for neighborhoods and an indicator of good citizenship and middle-class status for individuals (Rohe, 2012). Homeownership has been utilized to access or leverage funds for attending college, starting businesses, weathering financial emergencies, or preparing for retirement, among other purposes (Chang, 2010). Many consider homeownership a good strategy for building wealth over time, especially for low- and moderate-income people, including people of color (Belsky & Retsinas, 2005).
Figure 16.2 illustrates developments in the homeownership rate from 1995 to 2013, differentiated by race and ethnicity. Non-Hispanic white and black/African American homeownership rates peaked in 2004 at 76.0 and 49.7 percent, respectively. The Asian/other homeownership rate peaked in 2006 at 60.8 percent, and the Hispanic/Latino homeownership rate peaked in 2006 and 2007 at 49.7 percent (see chapter 7).
While the non-Hispanic white homeownership rate peaked in 2004, the foreclosure rate for this group gradually and then rapidly increased in 2009 (Reid, n.d.), as illustrated in figure 16.3. Thus the temporal gap between the decrease in the non-Hispanic white homeownership rate and the increase of the non-Hispanic white foreclosure rate may be attributed to the decrease in the non-Hispanic white proportion of the population and thus decreased household formation rates among non-Hispanic whites, followed by economic uncertainty and then the Great Recession.
The decrease in the black/African American homeownership rate after 2004 can be explained by the rather early and rapid increase in the fore-closure rate among blacks/African Americans in 2006 (Gottesdiener, 2013; Reid, n.d.), well before the increase in the national foreclosure rate in 2007. Blacks/African Americans have been disproportionately affected by the foreclosure crisis. For example, nearly 8 percent of this population group has been foreclosed upon since early 2007, compared to 4.5 percent of non-Hispanic whites, controlling for differences in incomes among the two groups (Bocian, Li, & Ernst, 2010). Elevated foreclosure rates among blacks/African Americans were partially triggered by their relatively low household incomes, their relatively low credit ratings (Traub, n.d.), and their increased exposure to subprime and other toxic mortgages (Jayasundera, Silver, Anacker, & Mantcheva, 2010).

FIGURE 16.2
Homeownership Rates by Race and Ethnicity, 1995–2013
Homeownership Rates by Race and Ethnicity, 1995–2013
Source: U.S. Bureau of Census, 2012.
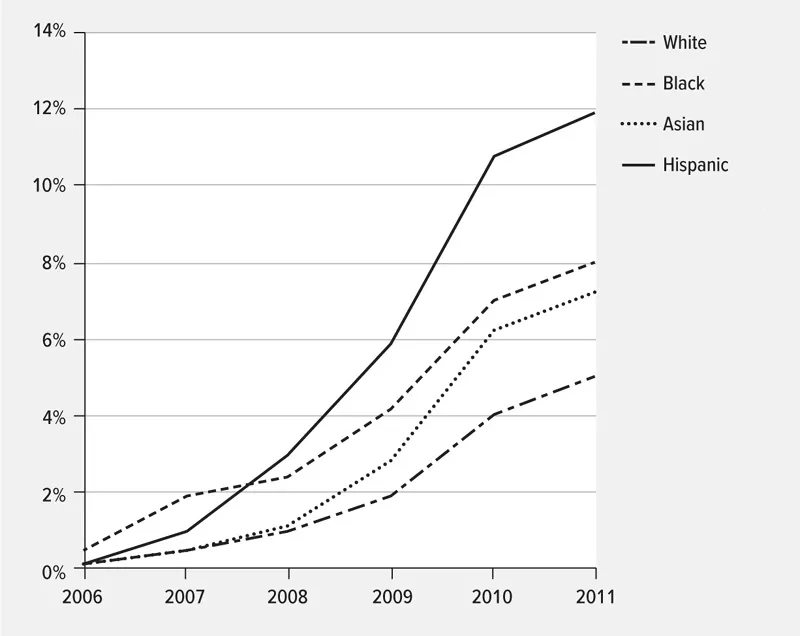
FIGURE 16.3
Proportion of Mortgages in Foreclosure or Real Estate Owned (REO) by Race and Ethnicity, 2006–11
Proportion of Mortgages in Foreclosure or Real Estate Owned (REO) by Race and Ethnicity, 2006–11
Source: Reid, n.d.
The peak in the Asian/other homeownership rate in 2006 may be attributed to the mortgage lending frenzy, partially fueled by this group’s relatively high household incomes and their relatively high credit ratings. These factors may also explain the lagged onset of foreclosures among them in 2008 (Reid, n.d.).
Finally, the peak in the Hispanic/Latino homeownership rate may be explained by the mortgage lending frenzy and the increase in population and thus relatively high household formation rates of Hispanics/Latinos, which superseded the onset of foreclosures among this ethnic group in 2007 (Reid, n.d.; see chapter 15).
The homeownership rate is influenced by many factors at the national and individual levels. The sections below will focus on individual and then macroeconomic factors that influence U.S. homeownership, followed by public policy factors. All sections focus on race and ethnicity.
INDIVIDUAL FACTORS THAT INFLUENCE HOMEOWNERSHIP BY RACE AND ETHNICITY
While many people face hurdles to homeownership, blacks/African Americans and Hispanics/Latinos face elevated hurdles, as they have higher unemployment and underemployment rates, lower household incomes, lower wealth, lower credit scores, and higher loan-to-value and debt-to-income ratios than non-Hispanic whites and Asians (Bhutta and Canner, 2013). In addition to these factors, many people of color are affected by racial and ethnic discrimination (Turner et al., 2013).
Unemployment influences homeownership. Mortgage applicants who are unemployed have very low odds of obtaining a loan in the first place. Borrowers who become unemployed or experience pay cuts often struggle to make their monthly mortgage payments (NeighborWorks America, 2013). While the unemployment rate peaked at 9.2 percent for non-Hispanic whites in October and November 2009, it peaked at 16.9 percent for blacks/African Americans in March 2010, at 8.4 percent for Asians in December 2009 and January and February 2010, and at 13.1 percent for Hispanics and Latinos in August 2009 (U.S. Bureau of Labor Statistics, n.d.b). However, by May 2014 the unemployment rate had decreased to 5.4 percent for non-Hispanic whites, 11.5 percent for blacks/African Americans, 5.3 percent for Asians, and 7.7 percent for Hispanics and Latinos (U.S. Bureau of Labor Statistics, n.d.b; see chapter 7). Figure 16.4 illustrates these patterns by race and ethnicity from January 2004 to May 2014.
While the decrease in the unemployment rate might be cause for celebration, it masks the fact that the underemployment rate has increased. The underemployment rate counts jobless workers who report that they are actively seeking work, who work part time but want and are available to work full time (“involuntary” part timers), and who want and are available to work and have looked for work in the last year but have given up actively seeking work (“marginally attached” workers) (Shierholz, 2013). The national under-employment rate was 13.4 percent, regardless of race or ethnicity, averaged for the second quarter of 2013 through the first quarter of 2014 (U.S. Bureau of Labor Statistics, n.d.a, n.d.b), although it was lower for whites and higher for blacks/African Americans and Hispanics/Latinos (Economic Policy Institute, 2014). The high underemployment rates for blacks/African Americans and Hispanics/Latinos relative to non-Hispanic whites and Asians indicates that the effects of the Great Recession on the labor market have been deep, and they have been more severe for people of color (see chapter 15). Figure 16.5 illustrates these patterns for whites, blacks/African Americans, and Hispanic/Latinos from 2000 to 2013.
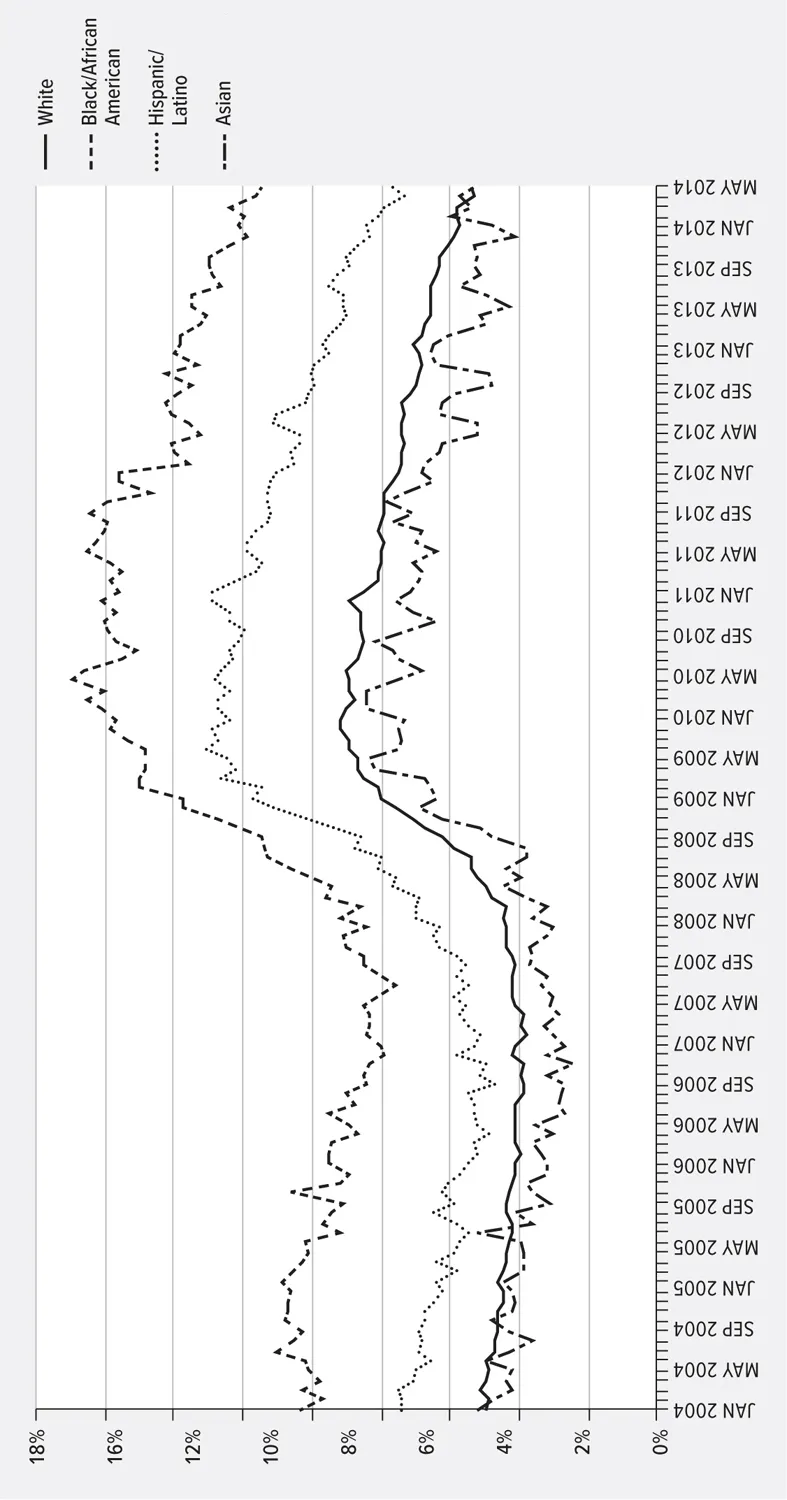
FIGURE 16.4
Unemployment Rate for Workers 16 Years and Over, January 2004–May 2014
Unemployment Rate for Workers 16 Years and Over, January 2004–May 2014
Source: Bureau of Labor Statistics, n.d.b.
Income and wealth levels are also drivers of homeownership. While the median household income for non-Hispanic white households was $57,952 for the period 2008–2012,1 it was $35,564 for black/African American households, $71,709 for Asian households, and $41,994 for Hispanic/Latino households (U.S. Bureau of the Census, n.d.), not ...
Table of contents
- Cover
- Title Page
- Copyright Page
- Dedication
- Contents
- Editors’ Introduction to Introduction to Housing, second edition
- SECTION I INTRODUCTION
- SECTION II HOUSING DESIGN
- SECTION III HOMEOWNERSHIP
- SECTION IV HOUSING POLICY
- SECTION V SPECIAL TOPICS IN HOUSING
- SECTION VI HOUSING IN A GLOBAL CONTEXT
- Glossary
- Contributors
- Index
Frequently asked questions
Yes, you can cancel anytime from the Subscription tab in your account settings on the Perlego website. Your subscription will stay active until the end of your current billing period. Learn how to cancel your subscription
No, books cannot be downloaded as external files, such as PDFs, for use outside of Perlego. However, you can download books within the Perlego app for offline reading on mobile or tablet. Learn how to download books offline
Perlego offers two plans: Essential and Complete
- Essential is ideal for learners and professionals who enjoy exploring a wide range of subjects. Access the Essential Library with 800,000+ trusted titles and best-sellers across business, personal growth, and the humanities. Includes unlimited reading time and Standard Read Aloud voice.
- Complete: Perfect for advanced learners and researchers needing full, unrestricted access. Unlock 1.5M+ books across hundreds of subjects, including academic and specialized titles. The Complete Plan also includes advanced features like Premium Read Aloud and Research Assistant.
We are an online textbook subscription service, where you can get access to an entire online library for less than the price of a single book per month. With over 1.5 million books across 990+ topics, we’ve got you covered! Learn about our mission
Look out for the read-aloud symbol on your next book to see if you can listen to it. The read-aloud tool reads text aloud for you, highlighting the text as it is being read. You can pause it, speed it up and slow it down. Learn more about Read Aloud
Yes! You can use the Perlego app on both iOS and Android devices to read anytime, anywhere — even offline. Perfect for commutes or when you’re on the go.
Please note we cannot support devices running on iOS 13 and Android 7 or earlier. Learn more about using the app
Please note we cannot support devices running on iOS 13 and Android 7 or earlier. Learn more about using the app
Yes, you can access Introduction to Housing by Katrin Anacker, Andrew T. Carswell, Sarah Kirby, Kenneth R. Tremblay in PDF and/or ePUB format, as well as other popular books in Politics & International Relations & Urban Planning & Landscaping. We have over 1.5 million books available in our catalogue for you to explore.