![]()
Advances in Geosciences
Vol. 30: Planetary Science and Solar & Terrestrial Science (2011)
Ed. Anil Bhardwaj
© World Scientific Publishing Company
ASYMMETRIC CRATERING ON THE MOON:
NUMERICAL RESULT FROM A
NEW NEA FLUX MODEL
TAKASHI ITO
The asymmetric cratering on satellites is generally related to the synchronous rotation of satellites. On the Moon, the asymmetric distribution of craters has been ascribed to the impacts of the near-Earth asteroid (NEA) population. However, the observed rayed crater distribution’s asymmetry on the Moon stared from a debiased NEA population is significantly more pronounced than what had been predicted by previous numerical studies. This suggests the existence of an undetected population of slower (low impact velocity) projectiles. In this paper, as an extension of our previous trials, we carried out numerical simulations of the orbital evolution of NEA-like particles generated from a new NEA flux model which contains substantial amount of high-inclination component as well as close-Earth component. We tried to determine their impact flux on the Moon and resulting asymmetric distribution of craters. The new model is considered to be closer to “true” distribution of NEAs than the conventional NEA flux model is. As a result we obtained slightly enhanced degree of cratering asymmetry from the new model. But it is not quite different from what the conventional model had yielded: The discrepancy between the observational crater record remains. Existence of more, slower objects is still implied from the current result.
1. Introduction
Many planetary satellites are locked in synchronous rotation, and their mean rotational angular speed and mean orbital motion is in a 1:1 commensurability. The synchronous rotation of these satellites leads to asymmetric spatial distribution of impact craters on these satellites: The leading hemisphere tends to have more craters than the trailing hemisphere, as is observed on the Galilean satellites of Jupiter, on Neptune’s moon Triton, and on the Moon around the Earth.1–5 Particularly, the asymmetric cratering on the Moon6,7 is quite interesting because it reflects the steady-state of modern near-Earth asteroids (NEAs) impact flux recorded on morphologically young and fresh craters with bright rays, called rayed craters.8 In the paper by Morota and Furumoto, the observed ratio of crater density (D > 5 km) at the apex to that at the antapex is shown to be ~1.65.6 In addition, there is a recent report that small seismic events observed by the Apollo mission can be used to obtain information of the current lunar bombardments with small magnitude.9 In the paper by Kawamura et al., the number density ratio of the seismic events of roughly 1.4–1.9 has been reported between leading and trailing sides.9
The degree of the leading/trailing asymmetric crater distribution on a synchronized satellite orbiting its mother planet is a function of satellite’s orbital velocity and the average relative velocity between projectiles and the satellite–planet system. When a satellite with a synchronous rotation has a large orbital velocity around its mother planet, or when the average relative velocity between projectiles and the planet–satellite system is small, the asymmetric distribution of craters becomes the most remarkable. Smaller orbital velocity of the satellite, or larger average relative velocity of projectiles, tends to diminish the asymmetry of crater distribution.
For the purpose to quantitatively test the hypothesis that impacts from the NEA population account for the observed asymmetric crater distribution on the Moon, in the past we had simulated numerically the spatial distribution of impacts of NEAs, using a numerical model with a steady-state population of impactors based on current estimates of debiased NEA population.10 Starting from the population of NEAs that had been through a debiased processing process,11, 12 we had compared the results of the simulation with the observed asymmetry of the population of rayed craters on the leading/trailing hemispheres of the Moon. Our numerical simulation had yielded a leading/trailing hemispherical ratio of ~1.32 for lunar impacts by NEAs, which is only marginally compatible with the observed ratio of ~1.65 found by the geological observation.6 For a comparison test, we carried out another set of numerical integrations of the raw, not debiased population of NEAs, expecting to contain more slower objects that can produce higher asymmetric cratering than the debiased population.13 However the resulting asymmetry turned out to be ~1.37, not as high as the observed asymmetry deduced from the rayed crater record. A possible explanation for the discrepancies is that there exists a hitherto undetected population of small objects whose average impact velocities on the Moon are much lower than the average impact velocity of the known NEA population. Other explanations are possible, including the possibility that a more comprehensive study of young lunar craters could reveal a smaller leading/trailing asymmetry and thereby remove the discrepancy with the dynamical modeling.
In this paper, as an extension of our previous studies,10, 13 we carried out yet another set of numerical integrations of an NEA population including a different type of component: Particles with higher inclination and smaller semimajor axis. The population is created through a synthetic NEA model that is based on the most credible basis of NEA dynamics and observation to date. Our numerical experiment in this paper will serve as a check as to how differently debiasing models work on changing the impact velocity distribution and asymmetric impacts of the Earth/Moon colliding projectiles.
In Sec. 2 we describe our model, method, and our choice of initial conditions. Our results on NEA encounters and collisions with the Earth–Moon system are given in Sec. 3. This section includes the result about the NEA impact fluxes, impact velocities and their spatial distribution on the Moon. In Sec. 4, we compare our numerical result with the actual observation record. Section 5 goes for some discussion.
2. Initial Conditions and Numerical Model
Our numerical model follows that in the paper by Ito and Malhotra, having two stages.10 In the first stage, our numerical integrations include the eight major planets and the Sun, and a large number of test particles with NEA-like orbits (Fig. 1). We numerically integrate their orbital evolution for up to 100 million years. Throughout these integrations, we record all close encounters of the particles that reach the Earth’s activity sphere (see Sec. 3 for more detail). We use this record in our second stage of numerical simulation, in which we adopt the restricted N-body model consisting of the Earth, the Moon, the Sun, and cloned test particles within the Earth’s activity sphere. In the second stage, we do not include the effects of any planets except the Earth but we include the Moon’s gravity. Our aim and numerical method are similar to those in what was published in previous literatures as numerical14 or analytical15, 16 work, but we believe our model is more realistic and straightforward.
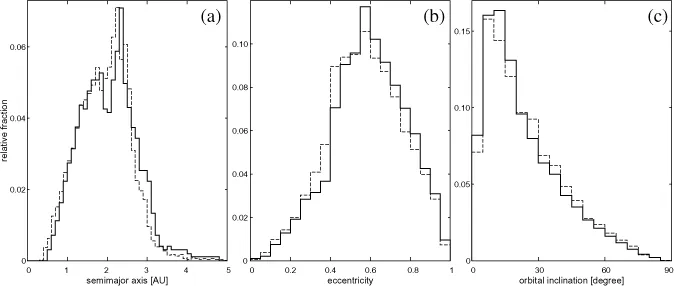
Fig. 1. Initial distribution of the osculating orbital elements of the NEA population in our numerical model of the first stage. (a) Semimajor axis, (b) eccentricity, and (c) orbital inclination. The solid lines are for the population A particles, and the dashed lines are for the population B particles.
For our first stage numerical simulation in this paper we used two different populations of NEA-like particles. Both from the synthetic, “debiased” NEA population models, but one of them is a conventional model, and the other is a revised one.
The conventional NEA model (hereafter called the population A) was devised in the paper by Bottke et al.12 This is also the model that we consulted as standard in our previous studies.10, 13 The NEA population described by this model is assumed to be continuously supplied from five intermediate source regions: the ν6 secular resonance in the main asteroid belt, the 3:1 mean motion resonance at 2.5 AU, the intermediate source Mars-crossers, the outer main belt, and the trans-Neptunian disk. This model is established by taking a linear combination of the (a, e, I) distributions from each of the source regions with best fit parameters based on the Spacewatch observation. The set of the population A particles in this paper has an orbital distribution that obeys the histograms shown in Fig. 12 of the paper by Bottke et al.12 which gives the debiased orbital distribution of the NEA of absolute magnitude H < 18. We produced 18,000 particles along with this distribution and used for the numerical integrations described in the next sections.
On the other hand, ther...