![]()
PART II
Hedge Funds, Sovereign Wealth
Funds and Other Investment
Agglomerations
![]()
Average Hedge Funds and their Evaluation1
Analyzing those who regularly beat a vanilla buy and hold strategy
We know that on average the typical mutual fund does not beat the market. The evidence is that professional managers all over the world have a hard time beating the market averages. In a given year, only about 25% to 40% of managers actually beat a buy-and-hold strategy of holding the index. Over longer periods, say 5-10 years, the percentage is even lower. There are a number of reasons for this.
•The market averages stay fully invested at all times, never missing market moves nor paying commissions for stock changes and market timing.
•When funds get behind the index, they often make hasty moves to try to catch up and, more often than not, this puts them further behind.
•Portfolio managers have a tendency to window dress at reporting times, adding to turnover and commissions.
•Since the managers collectively more or less are the market (with individual investors forming less and less of the market each year) the indices, on average, beat half of the fund managers. Then with commissions, fees, and these other reasons, only 25% to 40% typically beat the market averages (which does quite well with a lot less work).
•The fund managers take fees; the averages work for free.
•The fund managers' goals may get in the way of the fund's best interests which creates an agency problem.
•Portfolio managers tend to follow each other's moves. They tend to move the market which gains the full amount, and they can easily be a little behind.
We have the following four reasons the high commissions of active trading often lead to poorer performance than the market indices.
(1)commissions are higher in active portfolios because the turnover is greater.
(2)the bid-ask spreads are larger for many smaller international securities that an active manager would buy
(3)exchange taxes can be as large as 1% on both buys and sells
(4)active managers usually hold a small number of large positions so they have market impact on getting in and out.
Index funds have grown and grown. Dimension Fund Advisors formed by University of Chicago Professor Eugene Fama's students David Booth and Rex Sinquefield manage over $250 billion and others such as Barclays in San Francisco manage over $100 billion. This is done with low fees in an efficient manner. The indices for these passive funds have grown to include small cap, foreign investments and a variety of exchange traded funds as well as the traditional market index, the S&P500. Despite very low fees, profits are large. Booth was able to give the University of Chicago Business School $300 million and it is now the Booth Graduate School of Business.
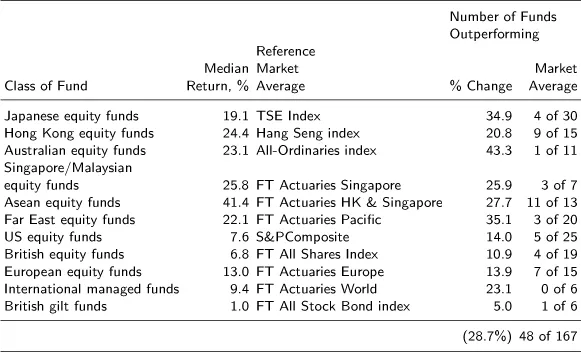
Table 4.1 shows results for 1988 for 167 funds based in Hong Kong with investments in various parts of the world. Only 48, or 28.7%, actually beat the benchmark indices. ASEAN equity funds did do well, averaging 41.4% returns versus the market's 27.7%, and 11 of the 13 funds beat this measure. But Japanese equity funds did not fare so well. Indeed only 4 out of 30 funds beat the TSE index of 34.9% and their average return was 19.1%, more than 15 points below the Topix.
Thus the efficient market proponents have one of their greatest success, namely that, for most of the time, most investors will do quite well by simply investing in index funds. Indeed, even the great investor David Swensen, who runs the Yale endowment discussed in Chapter 11, suggests that most people are well served with tax efficient exchange traded funds, see Swensen (2000).
Indeed from February 28, 2003 to July 20, 2007, the S&P500 has gained 82%. Whoops, that's in the declining US dollar. Meanwhile, gold in US dollars is up 82%, Brazil up 92%, the euro has risen from 0.87 in January 2002 to 1.38 in late July 2007, the British pound at 2.05 is at a decades high level and even the Canadian dollar, stuck at 63-64 cents for years until 2002 is at 95 cents. Even the Kiwi and Aussie dollars are flying with the Aussie up from 78 to 85 in just the last few months. The Chinese and Japanese currencies have been held back but that's given each of them over $1 trillion in foreign reserves. The Chinese stock market is the highest gainer, over 100% this past year in a strong currency.
Table 4.1: Sector Median Returns of Hong Kong Based Funds Compared with Market Average, January 1 to November 30, 1988. Source: Ziemba and Schwartz (1991)
Forsyth (2007) argues that these rises are simply due to global liquidity. But this situation is fast changing. Cheap funds for investments like the US sub-prime mortgages repackaged into various erroneously labeled AAA instruments and private equity levered buyouts is drying up especially seen in the implosion of the subprime instruments.
In the short term the Chinese investment in Blackstone which was purchased at a 4.5% discount from the IPO (about $31 per share) is underperforming T-bonds with the stock at 24. This Chinese investment is relationship based as well as an investment per se.2 It remains to be seen if the Chinese invest better than the Japanese did; see Ziemba and Schwartz (1992) for a discussion and a listing of Japanese trophy purchases that lost money. In trading one must always be ready for mini-storms at any time. And a new one has appeared in late July 2007 with the S&P500 falling over 50 points in two days and the VIX volatility index rising to over 24% very high for the year which saw a low of 9.39% but well below the 44% in 1998.
This chapter focuses on the average hedge funds and then on one of the current great funds, Renaissance's Medallion. For the average funds I look at the effects of incentives and the general partners' stake in the fund while Medallion, provides the opportunity to see how Ziemba's (2005) downside symmetric Sharpe ratio is a much better way to evaluate superior investors than the ordinary Sharpe ratio.
I discuss some aspects of hedge funds, specifically the very important risk control point that risk behavior is greatly improved in situations where the decision maker (eg, manager of the fund) holds (invests) a substantial portion of their own money. That is developed in a hedge fund management model that Roy Kouwen- berg and I developed where the effect of incentive fees on investment behavior can be studied.
Kouwenberg and Ziemba (2007) analyse the effect of incentive fees on risk taking in a continuous-time framework, taking management fees and the manager's own stake in the fund into account. They do not use a standard normative utility function like HARA for the preferences of the fund manager. Rather they use the behavioural setting of prospect theory - a framework for decision-making under uncertainty developed by Kahneman and Tversky (1979). This utility is based on actual human behaviour observed in experiments. Siegmann and Lucas (2002) argue that loss aversion, an important aspect of prospect theory, can explain the non-normal return distributions of hedge funds. Kouwenberg and Ziemba investigate how hedge fund managers driven by these preferences react to incentive fees. They also derive an expression for the value of the manager's incentive fee, as in Goetzmann, Ingersoll and Ross (2003). This call option on other people's money can be worth more than 17% of the invested value. Kouwenberg and Ziemba present a continuous time theoretical study of how incentives affect hedge fund risk and returns and an empirical study of the performance of a large group of operating hedge funds. Most hedge fund managers receive a flat fee plus a share of the returns above a benchmark. They investigate how these features of hedge fund fees affect risk taking by the fund manager in the behavioural framework of prospect theory. Their main conclusions are:
(1)In the theoretical study:
(a)the performance related component encourages funds managers to take excessive risk.
(b)However, risk taking due to incentive fees is greatly reduced if a substantial amount of the manager's own money (30%+) is in the fund. When the manager has 30%+ in the fund, the call option on other people's money drops dramatically from 18% to very little.
(2)In the empirical study (2078 hedge funds and 536 funds of funds; January 1995 - November 2000, Zurich hedge fund universe):
(a)Average returns though, both absolute and risk-adjusted, are significantly lower in the presence of incentive fees.
(b)Even after adjusting for style differences, the average hedge fund does not make back their fees, which average 2+20.
(c)Fund of funds have better performance than individual funds
The management fee covers expenses and provides business income. These fees should moderate risk taking, as negative investment returns reduce the future stream of income from management fees. Most fund managers invest their own money in the fund. This ‘eating your own cooking’, helps to realign the motivation of the fund manager with the objectives of the other investors in the fund. The fact that hedge fund managers typically risk both their career and their own money while managing a fund is a positive sign to outside investors. The personal involvement of the manager, combined with a good and verifiable track record, could explain why outside investors are willing to invest their money in hedge funds, even though investors typically receive very limited information about hedge fund investment strategies and also possibly face poor liquidity due to lock-up periods in some funds. The loss averse hedge fund managers increase risk taking in response to the incentive fees, regardless of whether the fund value is above or below the benchmark. One would expect that the hedge fund manager's own stake in the fund is an essential factor influencing the relationship between incentives and risk taking, and they find that the model predicts this.
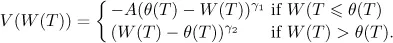
The utility function is
•The fund manager has a threshold θ(T) > 0 for separating gains and losses.
•
The parameters
and
determine the curvature of the value function over losses and gains...