![]()
Chapter 1
The Dimensions of Chronic Poverty in Asia
1.1Introduction
Poverty has several different dimensions. At any given time poverty can be measured as a shortfall in a minimum level of income needed to provide a sustainable level of consumption of food, clothing and affordable housing. There is also illiteracy due to lack of access to education; poor health due to inadequate services and access to potable water and little or no representation in the community. Often these dimensions of poverty become apparent when family income falls below some minimum income standard.
The World Bank in its comparative work around the world has used the standard of one US dollar a day per person as a benchmark for measuring poverty. Those whose income is below US$1 a day fall into the poverty category. While it leave out many factors, this simple income standard for measuring poverty is useful in making comparisons between different locations in a country as well as among different countries. The dollar a day standard made its debut in 1990 (World Bank, 1990) and has remained the standard for poverty line estimation until recently.
In mid-2008, the World Bank unveiled a new estimate of the poverty line, in light of inflation since 1980 and new estimates of purchasing power parity (see Ravallion et al., 2008; Ravallion et al., 2008a; and The Economist, 2008). One simple way to account for inflation would be to factor in US inflation which would bring the poverty line to about $1.45 in 2005. However Ravallion et al. (2008a) thought this estimate was a bit too high. Rather than abandon the poverty line concept Ravallion et al. (2008a) re-estimated the poverty line using similar methodology and better data. They gathered national poverty line data from 75 national estimates and picked the 15 lowest (13 sub-Sahara African countries and Nepal and Tajikistan). Averaging out they came to an estimate of the poverty line to about $1.25 per day using 2005 purchasing power parity terms.
How much difference does this make in poverty for Asian countries? It is hard to say right now, although the level of poverty will probably be a bit higher for most countries. Ravallion et al. (2008) made a first cut for China and found that poverty increased substantially using the new estimation procedure, from 74 million to around 200 million in 2005. However using the new standard developed by Ravallion et al. (2008) to measure poverty changes over time, the level of poverty fell by over 400 million between 1990 and 2004 compared with a previous estimated decline of around 250 million.
The most recent estimates of povety in Asia are displayed in Table 1.1. There are about 740 million people in poverty in this panel of countries and about 900 million in all of the Asia and Pacific region. The bulk of the poor are in three countries — India, China and Bangladesh.
Table 1.1 Head Count Ratio and Numbers in Poverty in Asia
| Country | Head Count Ratio — Proportion of Population in Poverty | People in Poverty (millions) |
| Bangladesh | 0.51 | 75 |
| Cambodia | 0.40 | 5.6 |
| China (rural) | 0.25 | 200 |
| China | 0.16 | 210 |
| India (rural) | 0.44 | 342 |
| Indonesia (rural) | 0.25 | 27 |
| Lao PDR | 0.35 | 2 |
| Nepal | 0.55 | 14.8 |
| Pakistan | 0.22 | 35 |
| Philippines | 0.22 | 19 |
| Vietnam | 0.23 | 19 |
Source: Asian Development Bank (2008) and Bauer et al. (2008).
To augment this approach adopted by the World Bank, the Asian Development Bank, other multilateral agencies and individual countries also have developed their own indices of poverty based on local standards and data sources.
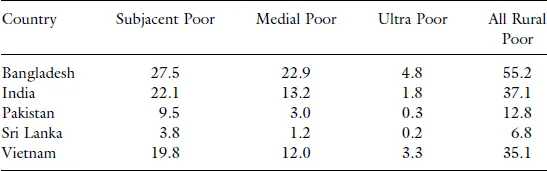
An interesting approach has been suggested by the International Food Policy Research Institute (IFPRI, 2007) which has broken down poverty incidence into three separate income categories that shows the depth of poverty as well as the absolute level. Measuring income in purchasing power parity terms they are the subjacent poor whose income is between $0.81 and $1.08 per day per person; the medial poor whose income is between $0.81 and $0.54 per day; and the ultra poor whole income is less than $0.54 per day. Estimates for selected countries are displayed in Table 1.2.
The estimates are somewhat different from the figures reported in Table 1.1, particularly for Pakistan and less so for India and Bangladesh. Nevertheless, they are interesting because they show the level of severe deprivation (ultra poor category) is less than 5 percent in all the countries sampled.
Who are the poor in Asia? Economic growth in East Asia has resulted in the reduction of poor households, especially for rural households over the past two decades. However the number of poor rose in South Asia over the same period. Furthermore the total number of households in rural poverty in South Asia was almost double that of sub-Saharan Africa. (World Bank, 2008 and Ravallion, Chen and Sangraula, 2008).
Table 1.2 Incidence of Rural Poverty by Depth of Poverty — Head Count Ratio (%)
Source: IFPRI (2007).
That brings us to the next question, which is the focus of our work in the remaining chapters of this monograph — what causes chronic poverty and what can be done about it? Causes of chronic poverty depend on (i) maintainers that keep households in poverty and (ii) drivers that cause households to fall into poverty traps. We will explore into greater depth the various causes of chronic poverty as we look into the respective country experiences over time in Chapter 7 and more generally in Chapters 2 and 3.
If a family is diagnosed as suffering from the shackles of chronic poverty, how can they break free? Exit routes are generally fastest when the chronic poor have the opportunity to participate in “new patterns of transformative growth” and when the government has sufficient revenue from taxation to spend on pro-poor expenditure (Chronic Poverty Research Center, 2008). Access to infrastructure, education and information are of vital importance especially for the poor residing in landlocked areas. Table 1.3 ranks the various efforts of Asian countries in reducing chronic poverty over the past 30 years. China, Indonesia and Vietnam have consistently improved their chronic poverty situations. Pakistan, Bangladesh, India are considered as partially chronically deprived. Lastly, Cambodia has the greatest degree of chronic deprivation. Chronically deprived countries are characterized by relatively low initial levels of welfare (relatively low GDP and relatively high child and infant mortality) and by their relatively slow rate of progress over time. They account for over 30 percent child and infant mortality and 17 percent of population earning less than US$1 day per day than their share of total population. Partially chronically deprived countries show relatively low levels of welfare but have shown at least relative slow rates of improvement. Consistent improvers would show faster rates of progress over time.
Table 1.3 Country Classifications of Poverty for Selected Asian Countries, 1970–2003
| Chronically Deprived Countries | Cambodia |
| Partially Chronically Deprived Countries | Pakistan, Bangladesh, Laos, Nepal, Philippines, India, Thailand, Mongolia, Myanmar |
| Partial Consistent Improvers | Malaysia |
| Across-the-board Consistent Improvers | China, Indonesia, Vietnam |
Source: Chronic Poverty Research Center (2008, p. 15), Table 2.
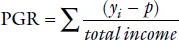
The further income is below the poverty line, the greater the depth of poverty experienced. By adding up the shortfalls in income relative to the poverty line we can develop a measure of the depth of deprivation. This total represents the income required to raise the income of everyone who is below the poverty line up to the poverty line. This poverty gap ratio (PGR) tells us the income required to raise everyone’s income to the poverty line divided by the total income of the entire population:
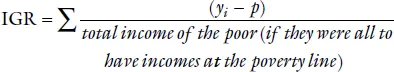
where yi is the income of the ith individual and p is the poverty line. All of the shortfalls in income of the poor are added and then divided by the total income of the community (GDP) in a year to arrive at the PGR. Alternatively, we can use the total income of the poor if all of them were to have income at the poverty line as the divisor. For example if the poverty line is US$1 per day and there were 1,000 poor people the divisor would be US$365,000. This ratio of the shortfalls in income for the year divided by the total income of the poor (US$365,000 in our example) is called the income gap ratio (IGR):
While the depth of poverty is a useful concept, it is not widely used since data on the relative poverty gap are not easy to generate.
We can also look at poverty over time. If a family is below the poverty line for a sustained period of time, five years or longer, we can say that the family is chronically poor. If a family comes in and out of poverty depending on circumstances that are temporal in nature such as temporary illness or unemployment, then the family is characterized as being temporarily poor. Families can have several bouts of poverty and still not be chronically poor.
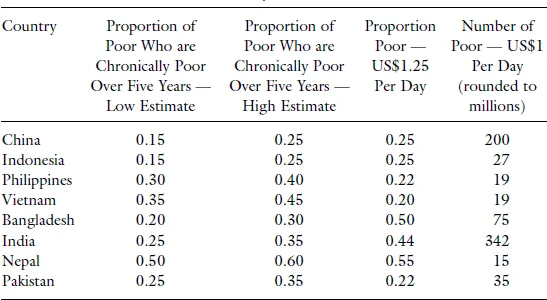
Chronic poverty can be mild or severe, depending on how far the family is below the poverty line. Generally however, all chronically poor are below the poverty line for an extended period of time. The Chronic Poverty Research Center (2008) has recently estimated the extent of chronic poverty for countries around the world where there are large numbers of chronically poor. These are reported in Table 1.4.
Who are the chronic poor in Asia? To be diagnosed as chronically poor, the household will have to be persistently poor and experience multidimensional deprivation for an extended period of time. However the length of time is arbitrary. According to Adams and He (1995), chronic poverty is indicated if the family is in the poorest quintile of the income distribution for three successive years. Other studies, such as McCulloch and Baulch (1999) put chronic poverty to being poor in all five years. It is also not easy to identify chronic poverty at a point in time as poverty trends can mask poverty dynamics. Some households could have moved out of poverty while other households moved into poverty and are still struggling to escape from poverty. Once they have fallen into poverty, intergenerational transmission of poverty is likely to occur unless they have access to educational and social capital.
Table 1.4 Poor and Chronically Poor in East Asia and South Asia
Source: Chronic Poverty Center (2008), Annex E; Asian Development Bank (2008).
According to the estimates from Chronic Poverty Research Center (2008, p. 9), the likelihood of households in South Asia suffering from chronic poverty is quite substantial. Estimates range between 126 million and 176 million. South Asia alone accounts for close to 40 percent of chronic poor in the world. For estimates of chronic poverty in selected Asian countries, see Tables 1.4 and Table 1.5.
Notice that there are some differences between the chronic poverty estimates in Tables 1.4 and 1.5. Aside from methodology, ...