![]()
Chapter 1
Monitoring the Fragmentation at Any Scale
1.1.Fluctuations of Maket Shares: A First Graph on Liquidity
1.1.1.The market share: A not so obvious liquidity metric
The fragmentation of a market usually occurs at different scales.
•At the scale of the market operators: New operators appear in the early phases (like Archipelago, Direct Edge, BATS in the US and Turquoise and Chi-X in Europe), then some of them merge to try to handle the fixed costs linked to operating market places.
•At the scale of trading venues: The same market operator (like Nyse-Euronext in Europe) can operate different trading venues (like the Nyse-Euronext Lit orderbook, plus Smartpool, plus Nyse-Arca). Typical BCN (Broker Crossing Network) are trading venues appearing because of fragmentation.
•At the scale of the orderbooks: The same trading venue can offer more than one orderbook. This is the case for most European RM (Regulated Markets) and MTF (Multilateral Trading Facilities). Chi-X offers Chi-X Lit and Chi-Delta (a Dark Pool) in Europe.
•At the scale of orders themselves, since when fragmentation increases, it is more and more necessary to split an order not just through time (to minimize its market impact, see Chapter 3, Section 3.3); but also through space, to spread the order among all the available orderbooks compatible with an execution policy, chasing liquidity.
Measuring fragmentation is thus not straightforward, since there is one adequate metric for each scale. Market share is nevertheless the most used metric. Monitoring the market share of each venue is a convenient way to understand the way the transactions migrate from one destination to another; it is an important component of the dynamic of the fragmentation of a market.
The market share is even not easy to define on one stock.
Definition 1 (Market Share). If N trading venues (1),
…,
(
N)
offer trading on the same stock k,
we can compute the Market Share (
n;
d)
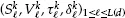
of the trading venue n on this stock during day d using the value of the transactions on the stock during this same day. Noting (
the L(
d)
trades of the day,
where S is the price,
V the quantity,
τ the time and δ the index of the trading venue on which the trade occurred (i.e.,
=
n if the lth transaction on security k during day d occurred on trading venue (
n)),
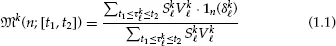
we can write the market share of the nth trading venue on the stock k between time t1 and t2: where 1a(
b)
is the indicator function: 1a(
b) = 1
when a =
b, zero elsewhere. Formally, the market share for a day d is just (
n; [
t1,
t2])
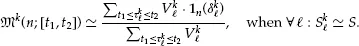
with t1 the first time of the day and t2 the last one. We can first notice that the market share in value (i.e.,
(
n;[
t1,
t2])) is not far from the market share in number of shares
over a period during which the price does not change a lot.
Another simple way to compute a market share is to do it per trade:
It is of importance to recognize that the market share relies on the interval of time considered too: The market share during the first hour of trading is usually not the same than the one on the last hour of trading (Section 2.1.2 in Chapter 2, shows how the market is subject to an intraday rhythm).
Moreover, taking into account the fixing auctions changes the computation of the market share, mostly because one venue usually has a monopoly in the fixing auctions.
1 If a trading venue
(
n) has an average market share of
m(
n) during the fixing auctions, and if the fixing auctions weight for
q in the overall exchange of the day (chart (a) of
Figure 1.1 given some numerical values for this in Europe),
then on average (
is the average daily turnover for the stock on the whole market):
Figure 1.1. (a) Market shares of main venues on the DAX components (visible venues, continuous auctions only), (b) Market shares of main venues on the DAX components (visible venues, continuous and fixing auctions), (c) Market shares of main venues on the DAX components (all traded volumes), (d) Market shares in Euros of European venues (EuroStoxx600 + FTSE100 components).
Source: Reuters monthly liquidity report, June 2012.
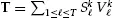
Another important decision in computing a market share on more than one stock is to choose a weighting scheme for the stocks:
•The most natural weighting with respect to the upper definition is to weight according to the daily turnover of considered stocks 1 ≤ k ≤ K:
•
It is also possible to weight the market share of a stock
k according to a weight
wk in a given index
:
the weight in an index being often proportional to the free-float or to the market capitalization of the stock, it is not equal to its daily turnover (see chart (b) of Figure 1.1).
•Another way of weighting is to give the same weight to each stock considered:
Figure 1.2 shows four different ways to measure the market share on the same basis for UK listed stocks. First the considered universe of stock is of importance: charts (a) and (d) use the same metric (the traded value), but on two different universes (the FSTE 100 — i.e. the Local Main Index — and the whole universe of stocks listed on the London Stock Exchange). It is obvious that the result is not similar, showing that the fragmentation is not the same for all stocks.
Figure 1.2. Two different market shares measurements for the UK-listed stocks in March 2013: (a) Including all visible trades (continuous and fixing auctions), and (b) including continuous auctions only. If a trader wants to know a proxy for the probability to have an order send during continuous actions executed, he needs to use figures of Figure (b), not (a).
Typically fragmentation increases with liquidity: the more liquid, the more fragmented. Section 2.3 in Chapter 2 provides a metric dedicated to study the homogeneity of the fragmentation across an index, the coverage.
To assess whether a metric is adequate, it is important to go back to the question the metric is supposed to answer:
•If we want to analyze the positioning and revenue of each trading venue, the market share all included can be of importance, even if in terms of revenue, the trading fees are usually not the same during the fixing auctions as during the continuous ones.
•
If we want to estimate
the probability that, when a trade occurs on security k, it is on trading venue (
n), then it can be better to not sum the fixing auctions with the continuous ones, and to follow two indicators: the market share during the fixing auctions and the one ex-fixing. Just note that in this case, the natural measure of market share is
(
n) of formula (
1.2).
•
If we want to estimate that
the probability that, when a unit of currency (Euro, dollar) is traded on security k, it is on trading venue (
n), then the classical market share in value (i.e.
(
n)) is the proper one, even if it can be better to make one measurement during the fixing auction (especially if there is 100% chance to be traded on a specific venue during the fixing) and another for the intraday.
This list shows that the market share measurement is clearly linked to trading optimization: It is a rough estimate of where the market participants are trading, on average. Section 3.3.2 in Chapter 3 shows how to be more subtle in using analytics to optimize smart order routing.
Besides, two of the listed meanings of the market shares are about “estimating the probability that….” To use them properly, we should take profit of the knowledge of probability estimations that is available in the literature.
Theoretical development: Estimation of a proportion and its confidence intervals. See Appendix A.7 for more details.
1.1.2.Phase 1: First attempts of fragmentation
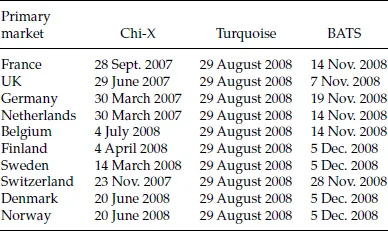
Once MiFID allowed the creation of new market operators in the equity markets, Europe has seen many new trading venues. To understand how it impacted the microstructure, it is enough to focus on Chi-X, Turquoise, BATS Europe, and NASDAQ-OMX Europe.
Table 1.1. Main MTF launch dates.
This is not to downplay the existence of other trading platforms, but to shed light on main mechanisms that took place during the fragmentation of European equity markets and influenced market participant behaviors.
Not all European stocks have been open to trading simultaneously, Table 1.1 gives open dates for three venues. It means that members of the historical exchanges had to follow a progressive calendar to open access to such venues. This asynchronous fragmentation allows us to do some comparative studies, like the one conducted on UK and Spanish markets in, Chapter 2, Section 2.4.1. That is also why it is interesting to study the fragmentation following a country-driven breakdown, since most often trading venues opened trading country by country.
One simple statistic to follow the fragmentation of European markets is thus the market share of the historical markets on each main index of each country (Figure 1.3).
It is obvious that the market share of historical markets decreased continuously since the beginning of competition. To go beyond this simple observation, we need to try to understand the goals and the stakes of fragmentation. If MiFID did not have a singular simple goal, it can nevertheless be said ex post that it targeted:
•The implementation of competition to halt the monopolistic position of historical exchanges.
•The promotion of a pan-European microstructure.
Figure 1.3. Market shares of the historical European exchanges on the usual regional indices.
Four years later, these two goals had been more or less been fulfilled:
•The Chi-X and BATS Europe merger created a large European platform in 2012 (this platform did not existed before MiFID, and continuously challenges its competitors);
•The LSE Group new includes the London Stock Exchange, the Borsa Italia and Turquoise, offering trading on all European stocks.
With Nyse-Euronext (despite the failure of its merger with Deutsche Boerse in 20122), these three firms dominate European equity markets.
This does not mean that the complexity of trading decreased with the emergence of three concentrated actors: they managed to offer a large diversity of trading pools, segmenting the liquidity to create niche markets. Each of these niche market offers a specific mix of liquidity between two kinds:
•The “natural liquidity”, coming directly from investors buying and selling for medium to long term held positions (weeks to months);
•The “opportunistic liquidity”, offered by the new high frequency traders and market makers (see [Menkveld, 2010]).
Since there is a debate around the significance and definition of these two kinds of liquidity, market operators identified quite early that their clients would be receptive to siloed offers: one market for the “lemon liquidity” and another for the “cheery liquidity...