![]()
Part I
Background Chapters
![]()
Chapter 1
China’s Per-Capita GNP at the Beginning
of Economic Reform
Introduction
This chapter was circulated in 1990 under the title “What is China’s Per-Capita GNP?” “Economic growth” means increases in a country’s GDP (gross domestic product) or GNP (gross national product) over a certain period of time. “Economic development” is conventionally defined to mean increases in per-capita GDP/GNP over a sustained period along with concomitant socio-economic changes. The original idea for circulating this chapter to the Singapore government was to ascertain China’s percapita GNP level when it first started economic reform and the open-door policy, as compared to its neighboring economies; and what the Chinese economy had achieved in the first decade (the 1980s) of economic reform.
This had turned out to be a very complicated exercise. First, the conventional GNP accounting that was standardized in the early 1950s by the United Nations into the commonly accepted “System of National Accounts or SNA” for all market economies, was not wholly adopted by China’s National State Statistical Bureau. Before the start of economic reform, China’s national income was based on the concept of “Net Material Product or NMP”, which was generally adopted by all the Soviet-type socialist economies. Typically, NMP excludes the service sector and other similar activities, which were considered unproductive under the Marxist definition.
Throughout the 1980s, China’s own system of national accounts was still in the process of adjusting to the international SNA format for definition and computation. By 1990, China’s National Statistical Bureau had not completed its transition as it continued to publish statistics based on both socialist and international concepts. For instance, it still used the concept of “Gross Social Product,” which is the total “social” output of agriculture, manufacturing, construction, communications and transportation, and commerce. Unlike the internationally accepted national income concept (which is based on value-added approach), gross social product counts all outputs at all levels of production, and hence it contains a lot of “double counting” in its gross aggregation process, e.g., the output of one industry is used by another industry as input.
Accordingly, the gross social product had exaggerated growth. If 1978 was used as a base year of 100, China’s gross social product increased to 306 in 1989 while national income increased to only 250. Later in the 1990s, as the National Bureau of Statistics continued with its reform and modernization of China’s domestic statistical system by moving closer to the international standards, it dropped gross social product approach. Subsequently, it had also done a few rounds of revising national income statistics upwards, particularly after it had undertaken a proper valuation of its service sector activities that were all along underestimated because of the socialist legacies.
Secondly, looking back, China in 1990 was still a messy half-reformed economy, particularly for its industrial sector in urban areas. Most of the key commodities were still under price controls while the state sector (state-owned enterprises) heavily dominated the economy. As a result, price distortion occurred everywhere. This made it hard to have a proper valuation of economic activities that would make national income a better reflection of the performance of the economy.
Worse still, the situation made it difficult to evaluate China’s national income or per-capita GDP/GNP from the international perspective, as all international comparison of GNP had to start with converting domestic national income into US dollar terms; and this would involve he exchange rate problem. China’s exchange rate was artificially fixed, and it was grossly overvalued until the exchange rate reform in 1994.
The World Bank first started to monitor China’s economic growth in 1976 and put down China’s per-capita GNP for 1976 (the year Mao Zedong and Zhou Enlai died) as US$410. Subsequently, per-capita GNP was adjusted downwards, partly to reflect the exchange rate movements, to US$230 for 1978 when Deng Xiaoping introduced economic reform, and US$290 for 1980. By 1989, it went up to US$350, giving an average annual growth of 9.7% for the period of 1980–1989.
In other words, most of China’s domestic economic activities in the initial phases of economic reform were grossly under-priced (a serious downward bias). This was further complicated by the overvaluation of the Renminbi exchange rate, which works in the opposite direction by exaggerating China’s GDP in international perspective. This problem was not specific to China, but was in fact common to all developing countries. But the problem was more serious for China as a transitional economy moving from central planning to the market system.
To remove the distortion caused by domestic price and exchange rate biases, economists led by Irving Kravis used the concept of “international price” to re-calculate a country’s domestic GNP for international comparison. This is conceptually similar to what is now commonly known as the purchasing power parity (PPP), which is essentially a kind of price index to compare prices of similar commodity in different countries.
This chapter goes into the PPP concept of China’s per-capita GNP in the 1980s, which was largely unfamiliar to economists and officials in China at that time. Thus, China’s “real” per-capita GDP at “1985 international prices” for 1988 was US$2,308, as compared to $786 for India, $10,417 for Singapore, $12,209 for Japan and $18,339 for the US. But China’s nominal per-capita GNP for 1988 was only US$330, i.e., it was almost seven times lower. The US–China difference in PPP per-capita GNP was about eight times. Twenty-five years later, in 2012, China’s per-capita GDP in PPP terms, as estimated by International Monetary Fund (IMF), was $8,400 while that for the US was $48,000. The US–China gap is still more than six times.
China has achieved spectacular economic growth performance for over three decades with its GDP increasing at 9.9% a year. By 2012, China had already overtaken Japan as the world’s second largest economy, with its total GDP slightly over 50% of the US level. In term of per-capita GDP (which can better reflect the average living standard), China’s nominal level at the start of 2013 is about US$6,000 or $9,000 in PPP terms. China is still a long way from becoming an affluent society.
This chapter, apart from explaining China’s GDP/GNP at the starting point of its economic reform and its various ramifications, also provides a simple, easy-to-understand explanation of various methods of national income accounting. This should be a useful update for non-specialists of the needed basic concepts to understand and interpret China’s economic progress.
Conventional Indicator Tends to Mislead
For lack of a better measuring rod, governments and international organizations have been consistently using increases in GNP (gross national product) — defined as the total volume of goods and services produced in a country — as an indicator of economic growth, and also using per-capita GNP (GNP divided by population) as a yardstick to judge a country’s living standards and its level of productivity. But the problem comes to a head when a large, poor country like China, which has experienced record economic growth in the 1980s in both total GNP and per-capita GNP terms and yet its per-capita GNP expressed in US dollar shows little increase over the past decade. Clearly, such conventional measure has failed, in this circumstance, to reflect the actual level of material progress China has achieved during the last 10 years.
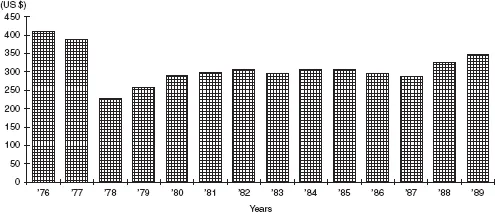
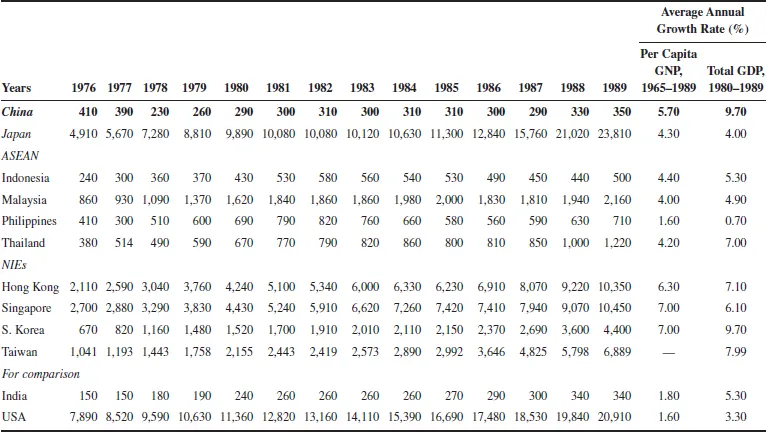
In 1978, the World Bank published the first issue of World Development Report which gave China’s per-capita GNP for 1976 as US$410 (compared to US$150 for India and US$2,700 for Singapore for the same year). In the subsequent yearly reports of the World Bank, China’s per-capita GNP, as shown in Fig. 1a, plummeted to US$230 for 1978 and then fluctuated around US$300 until it reached US$350 for 1989 (compared to US$340 for India and US$10,450 for Singapore). A layman would certainly be baffled as to why China’s per-capita GNP in the 1980s had become stagnant while the other less fast-growing Asian economies had registered a steep rise in their per-capita GNP levels, as evident in Table 1.
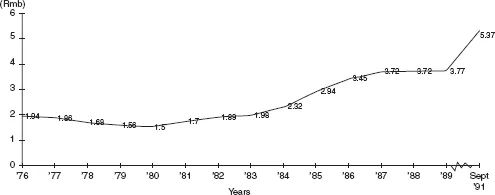
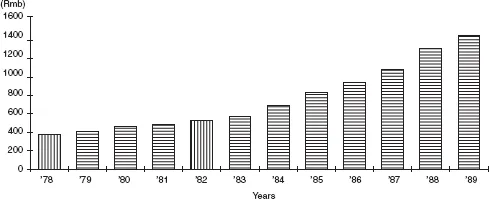
Economists could explain away the problem by arguing that the World Bank had probably overestimated China’s GNP in the late 1970s to begin with, because China was then following the socialist GNP accounting system (to be explained later); and that China’s per-capita GNP through the 1980s was “brought down” by several rounds of depreciation of the Chinese Renminbi, i.e., due to distortion from the exchange rate conversion (Fig. 1b). This can be seen from the fact that China’s per-capita GNP as expressed in Renminbi clearly shows steady increase (Fig. 1c). Nonetheless, the upshot serves to highlight one of the basic deficiencies of this important economic indicator.
Figure 1a. China’s Nominal Per-capita GNP in US Dollars, 1976–1989.
Source: World Bank. World Development Report. (From 1978 to 1991.)
Table 1. China’s Nominal Per-capita GNP in Regional Perspective (US Dollars).
Source: World Bank: World Development Report (from 1978 to 1991); for Taiwan, Statistical Yearbook of Republic of China, 1990 (Taipei, Executive Yuan, 1991).
Figure 1b. Fluctuation in China’s Exchange Rate, 1976–1991 (Rmb Per US Dollar).
Source: Economic & Development Resource Center. Asian Development Bank. Key Indicators of Developing Asian & Pacific Countries. 1989–1990.
Figure 1c. China’s Nominal Per-capita GNP in Renminbi, 1978–1989.
Sources: World Bank. China: Macroeconomic Stability & Industrial Growth Under Decentralized Socialism, 1990. And, Statistical Yearbook of China, 1990.
Worse still, when the per-capita GNP figures of countries are all listed in terms of the US dollar, one inevitably tends to use them to compare if a certain country is rich or poor, “developed” or “developing”. A Singaporean, for example, will be tempted to pass the judgment that Singapore’s per-capita GNP being 30 times higher than that of China, the average Singaporean should be economically or materially 30 times better off than the average Chinese. This is simply not the case. A typical Singaporean worker may take home a pay-packet which is many times, perhaps 10 times but certainly not 30 times, more than his counterpart in China can take home. Furthermore, the pay of our Singaporean worker certainly does not enable him to purchase the amount of goods and services in Singapore which is 30 times more than the Chinese worker can buy in China out of his own pay — we all know that most daily necessities and essential services are so much cheaper in China than in Singapore.
To correct such a bias in international comparison, economists have separated the concept of nominal per-capita GNP from that of real per-capita GNP. The former refers to the conventional measure, which is widely used by governments and international media. It is obtained simply by converting a country’s GNP in its national currency into US dollars at the prevailing exchange rate. More sophisticated, the latter is purported to provide an adequate inter-country comparison by taking into account the purchasing power of the national currencies over the GNP of the countries involved, i.e., GNP for different countries is all expressed in the same set of “international prices” or in the common “international dollars”, so that the problem of price differences such as a bottle of Tsingtao beer for S$4.20 in Singapore vis-a-vis Rmb 1.20 (equivalent to S$0.40) for the same bottle in China is duly taken care of.
Recently, Professor Angus Maddison, Chief Economist at the OECD Development Centre, has calculated the real GDP of China for 1987 at 1980 “international” prices and arrived at the estimate of US$1,748, which is six times higher than China’s nominal level of US$290 from the conventional estimate by the World Bank.1 In a separate study by Professors Robert Summers and Alan Heston, the real per-capita GDP of China for 1988 at current “international prices” was worked out to be US$2,472, which is more than seven times higher than China’s nominal level of US$330 from the World Bank.2 The new figures would rank China with the world’s “lower-middle-income” countries, with China’s real GDP per capita being higher than that of Indonesia and the Philippines but lower than that of Thailand. Also, Singapore’s real per-capita GDP was only 4.2 times of China’s, not 30 times as indicated by the nominal measure. Viewed in this context, China is not really that poor.
“Nominal GDP” vs “Real GDP”
National income (NI), gross domestic product (GDP), and GNP are closely related concepts, which are often used interchangeably, with only minor differences. Broadly speaking, the three terms refer to the total monetary value of all goods and services produced in an economy over a period of time. “National income” is more like a generic concept. “Gross domestic product” measures the total final outputs of goods and services produced by the economy within the country’s territory by both residents and non-residents. “Gross national product” measures the total domestic and foreign output claimed by residents of a country. Thus it should comprise gross domestic product plus factor incomes accruing to residents from abroad. Except for economies with large external activities, the GDP and GNP for most countries are quite close. For China, the two in Renminbi are almost identical.
GNP accounting has been standardized by the United Nations into the System of National Accounts or SNA for all market-based economies. Generally speaking, NI can be computed by three methods: (i) income approach: this adds up all incomes from wages, rent, interest, and profits (both dividends and undistributed profits) together with indirect business taxes to form net national income at market prices; (ii) Value-added approach: this adds up the final output of all firms or sums up the value-added at each stage of production (i.e., sales minus costs to leave out intermediate products so as not to “double count”) to arrive at GDP at factor cost; and (iii) expenditure approach: this adds up total private consumption expenditure, government expenditure, total domestic fixed investment, and changes in stocks, and then adjust for exports and imports, to arrive at GDP at factor cost. Finally, when foreign incomes are adjusted for local residents, GDP will become GNP. The formidable problems that generally face developing countries in computing an accurate SNA are well-known, e.g., the data availability and problems of definition. Since large segments of productive activities in developing countries are in agriculture and services, it is difficult enough for them to measure all the outputs, not to mention valuing them properly. Furthermore, the GNP of a poor country is more likely to be under-estimated because many economic activities do not go through the market system, and hence they are exclusion from the GNP account.
Socialist countries, following Marx’s prejudice against services by considering them “unproductive”, have generally used a narrower concept of net material product or NMP, which is roughly equivalent to the conventional GNP minus some but not all service activities. In the socialist approach to NI, the key step is to make a distinction between “material” and “non-material” production. Thus, all activi...