![]()
CHAPTER 1
SIMULATORS AS HYDRAULIC TEST FACILITIES AT DIKES
AND OTHER COASTAL STRUCTURES
Jentsje W. van der Meer
Principal, Van der Meer Consulting BV,
Professor UNESCO-IHE, Delft, The Netherlands
P.O. Box 11, 8490 AA, Akkrum, The Netherlands
The first part of this chapter gives a short description of wave processes on a dike, on what we know, including recent new knowledge. These wave processes are wave impacts, wave run-up and wave overtopping. The second part focuses on description of three Simulators, each of them simulating one of the wave processes and which have been and are being used to test the strength of grass covers on a dike under severe storm conditions. Sometimes they are also applied to measure wave impacts by overtopping wave volumes.
1. Introduction
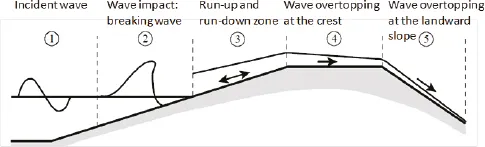
When incident waves reach a coastal structure such as dike or levee, they will break if the slope is fairly gentle. This may cause impacts on the slope in zone 2, see Figure 1. When large waves attack such a dike the seaward side in this area will often be protected by a placed block revetment or asphalt. The reason is simple: grass covers cannot withstand large wave impacts, unless the slope is very mild.
Above the impact zone the wave runs up the slope and then rushes down the slope till it meets the next up-rushing wave. This is the run-up and run-down zone on the seaward slope (zone 3 in Figure 1). Up-rushing waves that reach the crest will overtop the structure and the flow is only to one side: down the landward slope, see zone’s 4 and 5 in Figure 1. Design of coastal structures is often focussed on design values for certain parameters, like the pmax,2% or pmax for a design impact pressure, Ru2% for a wave run-up level and q as mean overtopping discharge or Vmax as maximum overtopping wave volume. A structure can then be designed using the proper partial safety factors, or with a full probabilistic approach. For wave flumes and wave basins, the waves and the wave processes during wave-structure interaction are simulated correctly using a Froude scale and it are these facilities that have provided the design formulae for the parameters described above.
Figure 1. Process of wave breaking, run-up and overtopping at a dike (figure partly from Schüttrumpf (2001)).
Whether the strength of coastal structures can also be modelled on small scale depends on the structure considered. The erosion of grass on clay cannot be modelled on a smaller scale and one can only perform resistance testing on real dikes, or on parts moved to a large-scale facility as the Delta Flume of Deltares, The Netherlands, or the GWK in Hannover, Germany. Resistance testing on real dikes can also be performed by the use of Simulators, which is the subject of this chapter. Each Simulator has been developed to simulate only one of the processes in Figure 1 and for this reason three different types of simulator are available today.
If one wants to simulate one of these processes at a real dike, without a wave flume or wave basin, one first has to describe and model the process that should be simulated. Description of the wave-structure-interaction process is, however, much more difficult than just the determination of a design value. The whole process for each wave should be described as good as possible.
2. Simulation of Wave Structure Interaction Processes
2.1. General aspects
Three different wave-structure-interaction processes are being recognized on a sloping dike, each with design parameters, but also with other parameters that have to be described for all individual waves. An overall view is given below.
Impacts: Design parameters: pmax, 2%; pmax
Description of process: distribution of impact pressures, rise times, impact durations, impact width (Bimpact,50%) and impact locations;
Wave run-up and run-down: Design parameters: Ru2%; Rd2%
Description of process: distributions of run-up and run-down levels, velocities along the slope for each wave;
Wave overtopping: Design parameters: q; Vmax
Description of process: distributions of individual overtopping wave volumes, flow velocities, thicknesses and overtopping durations.
2.2. Wave impacts
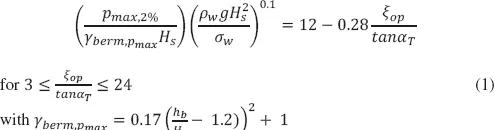
A lot of information on wave impacts has been gathered for the design of placed block revetments on sloping dikes. Klein Breteler [2012] gives a full description of wave impacts and a short summary of the most important parameters is given here. Wave impacts depend largely on the significant wave height. For grassed slopes on a dike the wave impact is often limited, say smaller than Hs = 1 m, otherwise the slope would not be able to resist the impacts. Tests from the Delta Flume with a wave height of about 0.75 m have been used to describe the process of wave impacts. The 2%-value of the maximum pressure can be described by [Klein Breteler, 2012]:
where:
| g | = acceleration of gravity [m/s2] |
| Hs | = significant wave height [m] |
| hb | = vertical distance from swl to berm (positive if berm above swl) [m] |
| pmax, x% | = value which is exceeded by x% of the number of wave impacts related to the number of waves [m water column] |
| αT | = slope angle [°] |
| γberm, pmax | = influence factor for the berm [-] |
| ρw | = density of water [kg/m3] |
| σw | = surface tension [0.073 N/m2] |
| ξop | = breaker parameter using the peak period Tp [-] |
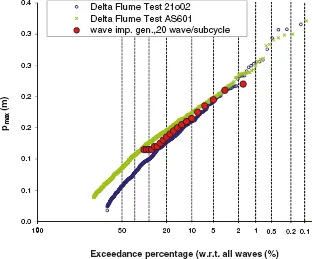
The tests in the Delta Flume clearly showed that the distribution of p is Rayleigh distributed, see Figure 2. The graph has the horizontal axis according to a Rayleigh distribution and a more or less straight line then indicates a Rayleigh distribution. This is indeed the case in Figure 2.
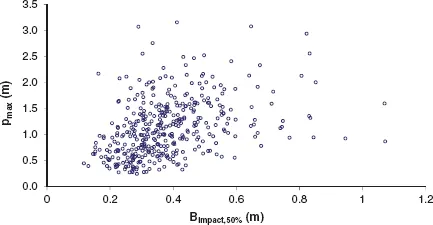
Each parameter can be given as a distribution or exceedance curve, but often the relationship between two parameters is not so straight forward. Figure 3 shows the relationship between the peak pressure and the corresponding width of the impact, Bimpact, 50% for a wave field with Hs ≈ 0.75 m. It shows that peak pressures may give values between 0.25 and 3 m water column, whereas the width of impact may be between 0.15 and 1 m, with an average value around 0.4 m. But there is hardly any correlation between both parameters.
Figure 2. Peak pressures of impacts, measured in the Delta Flume and given on Rayleigh paper. Also simulated pressures are shown (described later in the chapter)
Figure 3. Peak pressures of impacts versus the width of the impacts (Delta flume measurements [Klein Breteler, 2012]).
2.3. Wave run-up and run-down
The engineering design parameter for wave run-up is the level on the slope that is exceeded by 2% of the up-rushing waves (Ru2%). The EurOtop Manual [2007] gives methods to calculate the overtopping discharge as well as the 2% run-up level for all kinds of wave conditions and for many types of coastal structures. Knowing the 2% run-up level for a certain condition is the starting point to describe the wave run-up process. Assuming a Rayleigh distribution of the run-up levels and knowing Ru2% gives all the required run-up levels. As the EurOtop Manual [2007] is readily available, formulae for wave run-up have not been repeated here.
The wave run-up level is a start, but also run-up velocities and flow thicknesses are required. From the wave overtopping tests it is known that the front velocity is the governing parameter in initiating damage to a grassed slope. Focus should therefore be on describing this front velocity along the upper slope. By only considering random waves and the 2%-values, the equations for run-up velocity and flow thickness become:
where:
| u2% | = run-up velocity exceeded by 2% of the up-rushing waves |
| cu2% | = coefficient |
| g | = acceleration of gravity |
| Ru2% | = maximum level of wave run-up related to the still water level swl |
| ZA | = location on the seaward slope, in the run-up zone, related to swl |
| h2% | = flow thickness exceeded by 2% of the up-rushing waves |
| ch2% | = coefficient |
The main issue is to find the correct values of cu2% and ch2%. But comparing the results of various research studies [Van...