![]()
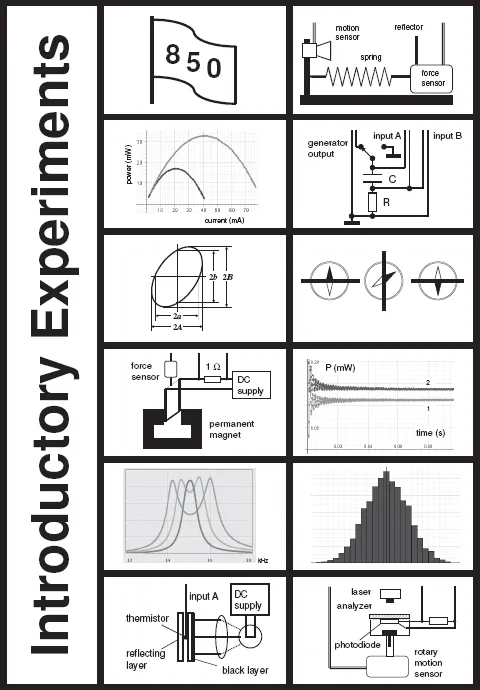
1. Introductory Experiments
Data-acquisition systems from PASCO
ScienceWorkshop 750 Interface and DataStudio software
850 Universal Interface and Capstone software
1.1. Mass on spring
1.2. Torsional pendulum
1.3. Hooke’s law
1.4. Characteristics of DC source
1.5. Digital storage oscilloscope
1.6. Charging and discharging a capacitor
1.7. Charge and energy stored in a capacitor
1.8. Speed of sound in air
1.9. Lissajous patterns
1.10. I–V characteristics
1.11. Light bulb
1.12. Short time intervals
1.13. Temperature measurements
1.14. Oersted’s great discovery
1.15. Magnetic field measurements
1.16. Magnetic force
1.17. Magnetic braking
1.18. Curie’s point I
1.19. Electric power in AC circuits
1.20. Faraday’s law of induction I
1.21. Self-inductance and mutual inductance
1.22. Electromagnetic screening
1.23. LCR circuit I
1.24. Coupled LCR circuits
1.25. Probability functions
1.26. Photometric laws
1.27. Kirchhoff’s rule for thermal radiation
1.28. Malus’ law
1.29. Infrared radiation
1.30. Irradiance and illuminance
Data-acquisition systems from PASCO
In most of the experiments and demonstrations, we use the ScienceWorkshop 750 Interface and DataStudio software or 850 Universal Interface and Capstone software from PASCO scientific. The following brief introduction considers some options provided by these data-acquisition systems.
ScienceWorkshop 750 Interface and DataStudio software
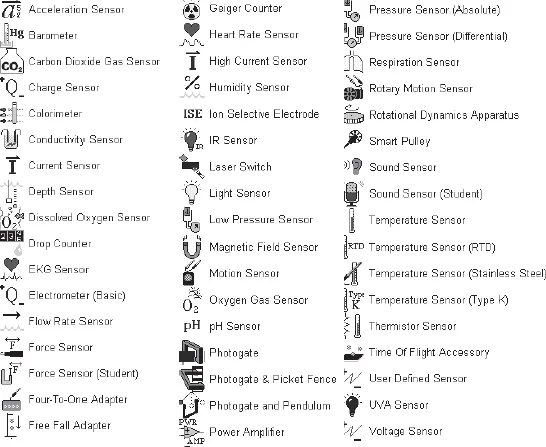
PASCO scientific provides a great number of sensors (Fig. 1).
Fig. 1. List of sensors provided by PASCO scientific.
We use only a part of the sensors available, namely: Broad spectrum light sensor (CI-6630), Force sensor (CI-6537), High-accuracy temperature sensor (CI-6525), Light sensor (CI-6504A), Magnetic field sensor (CI-6520A), Motion sensor (CI-6742), Power amplifier II (CI-6552A), Radiation sensor (TD-8553), Rotary motion sensor (CI-6538), Sound sensor (CI-6506B), Thermistor temperature sensor (CI-6527A), and Voltage sensor (CI-6503).
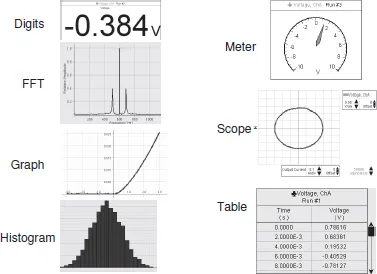
Displays. Many options exist for displaying results obtained by measurements or calculations: Digits, Fast Fourier Transform (FFT), Graph, Histogram, Meter, Scope, and Table (Fig. 2).
Fig. 2. DataStudio displays for measurement and calculation of data.
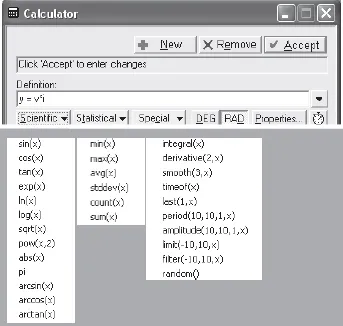
The Calculate tool is used in many experiments. To calculate new functions, one has to write down the necessary function and to define the sources of data for the calculations (Fig. 3). Along with usual polynomials, the tool provides some functions that fall into three categories, Scientific, Statistical, and Special.
Fig. 3. Dialog box of the Calculate tool.
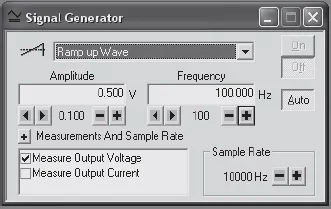
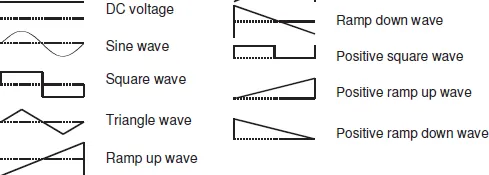
Signal generator incorporated into the 750 Interface produces a variety of output voltages (Figs. 4 and 5). It the Auto regime, it builds the output voltage after pressing the Start button.
Fig. 4. Dialog box of the Signal generator.
Fig. 5. List of output voltages produced by the Signal generator.
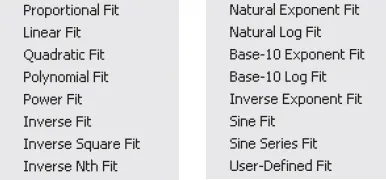
Fits provided by DataStudio. The Fit option includes proportional, linear, and many other functions (Fig. 6). The parameters of the fits and their standard deviations are added to the graphs.
Fig. 6. Fit options provided by DataStudio.
In some experiments, a significant scatter of the data may appear. In such cases, the Smooth option solves the problem. This operation is used, for instance, when determining the heat of vaporization of nitrogen. The Force sensor measures the weight of a Dewar flask with liquid nitrogen. A significant scatter of the data occurs during the intensive boiling of the liquid (Fig. 7). The measurement data are smoothed by using the option Calculate/Special/ Smooth (30, x), that is, the smoothing involves 30 adjacent data points. In this example, only data from the Force sensor are smoothed. Both X and Y data can be smoothed when necessary.
Fig. 7. Original measurement data and results after smoothing.
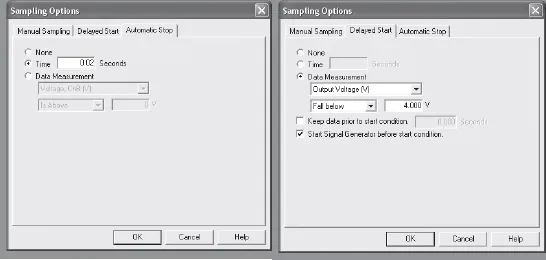
Sampling. This option allows one to start and to stop data acquisition according to a preset time interval or definite measurement data (Fig. 8). These options are very important when the data acquisition lasts a very short time interval. Manual sampling of the data is also possible.
Fig. 8. Dialog box for Sampling options.
850 Universal Interface and Capstone software The new data-acquisition system is much more powerful than previous PASCO systems and provides new possibilities for creating or improving laboratory experiments and classroom demonstrations (Kraftmakher 2013c). The version 1.1.1 of the new data-acquisition system contains many options, and it is impossible to immediately disclose all their applications. This process will last a certain time. A brief review given below is rather an introduction to the new data-acquisition system.
The new 850 Interface (Fig. 9) supports all PASCO sensors, while the Capstone software is compatible with all PASCO USB interfaces and contains more options for processing experimental data. The new interface includes three built-in function generators. One of them (Output 1) is a power generator (±15 V, 1 A) providing voltages of various waveforms: DC, sine, square, triangle, ramp (up and down); a regulated DC offset is possible for the AC voltages. The frequency range of the generator is 1 mHz to 100 kHz, and the frequency sweep option is provided. One only needs to specify the initial and final frequencies and the sweep time. This option is very useful for determining frequency response of frequency-dependent circuits or devices. For instance, resonance curves of a pendulum or LCR circuits can be displayed without using additional function generators with VCF (voltage controlling frequency) inputs. The output voltages and currents can be recorded and processed as measurement data. The same relates to the frequency of the output voltage.
Two other built-in function generators (Outputs 2 and 3) provide the same waveforms in the frequency range of 1 mHz to 500 kHz. The amplitude range is ±10 V, 50 mA. The generators provide independent control of the waveform, frequency, and amplitude of the output...