![]()
PART I
Population and Social Fundamentals
![]()
Chapter 1
Ageing in Singapore:
Social Issues and Policy Challenges
Yap Mui Teng and Christopher Gee1
Singapore’s transition from a young, rapidly growing, high fertility population into a rapidly ageing one with prolonged low, below replacement fertility and low domestic population growth is one of the most significant social transformations the country has undergone over the last fifty years (Yap, 2010, p. 183).
In 1970, the total population of Singapore registered at two million. Since then, Singapore’s population has nearly tripled in size to 5.4 million in 2014 (Department of Statistics [DOS], 2014). Underlying this population boom however, is a myriad of demographic developments that has fundamentally altered the small island state’s population structure within a relatively short time span of 50 years. From a young nation-state in 1970 where the median age of its population was 19.5 years, the median age has now doubled to 39.3 years in 2014 (ibid.) which makes Singapore one of the fastest ageing countries in the world. This demographic shift is even more pronounced when compared to its ASEAN neighbours. Numerically, Singapore has the lowest number of elderly (defined as those aged 60 years and older), at about 814,000, compared to other countries such as Indonesia which had over two million elderly in 2012 (United Nations [UN], 2012). Yet amongst the 10 ASEAN countries, Singapore has the highest proportion of the population that is elderly, at 15.6%. Comparatively, the elderly in other ASEAN nations (with the exception of Thailand) make up less than 10% of the population, with Laos registering a mere 5.7%, making it the “youngest” of the 10 countries (ibid.).
The issue of a rapidly ageing Singapore population has now reached an important turning point. According to DOS projections, the proportion of the aged will rise to 18.7% of the resident population in 2030 with nearly 900,000 persons in this age category. Simply put, roughly one in five of Singapore’s population will be elderly in less than two decades. This presents significant social, economic and political implications to this small, highly urbanised and industrialised nation-state (Yap, 2010). This chapter will begin with an overview of Singapore’s demographic trends since the nation’s independence in 1965. Next, both the public and private spheres of ageing will be examined. The public sphere of ageing will cover the social issues arising out of this demographic shift in tandem with the policies that have been put in place thus far. The private sphere of ageing will examine the state of the elderly person in terms of financial security, health and social well-being. The chapter will end with a discussion of the possible policy challenges ahead.
Singapore’s demography: Declining fertility, greater life expectancy and liberal immigration policy
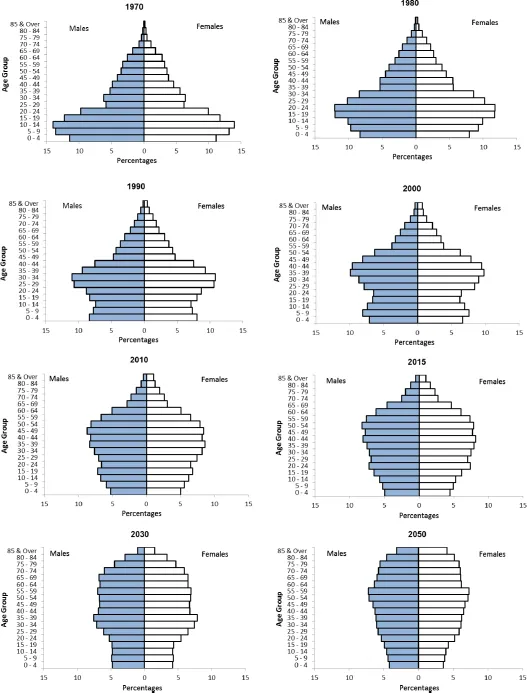
As elsewhere, population ageing in Singapore is influenced by changes in fertility, mortality and migration. These processes have shaped the age-sex structure of Singapore’s population, which has shifted from one of a typical pyramid in 1970 to what has been called a “beehive” shape in 2010 (see Figure 1.1).
The country experienced an extended baby boom in the post-World War II period, lasting from about 1947 to 1964. The total fertility rate (TFR, or average number of children a woman could expect to have over her lifetime at fertility levels prevalent in the particular year) reached an unprecedented TFR of 6.56 children per woman in 1957 while annual births averaged about 60,000 over the period 1956– 65 (DOS, 2002). This high fertility trend tapered down in the mid-1960s following Singapore’s independence. A strict family planning programme in the 1970s as well as improving social and economic circumstances saw the TFR fall to the replacement level of 2.1 in 1975 and 1976, with annual births falling to about 46,000 over the period 1966–76. By 1977, the TFR fell below the replacement level and continued to fall thereafter (Yap, 2010). From the mid-1980s, the government changed its anti-natalist stance to one that was decidedly pro-natalist to curb the declining fertility rate. The new population policy “Have three, or more if you can afford it” was officially launched on 1 March 1987. Subsequent measures to boost fertility rates, however, yielded little results and Singapore now ranks among countries with the “lowest-low” fertility levels of 1.3 children per woman or lower — along with Japan, Korea, Hong Kong, and the Southern, Central and Eastern European countries. The TFR among Singapore’s resident population, comprising citizens and permanent residents, in 2013 (the latest year for which data are available) is only 1.19 children per woman, with births numbering only 39,720 (ibid.).
Fig. 1.1 Age-Sex Structure of the Singapore Resident Population, 1970–2050.
Source: DOS, Census 1970, 1980, 1990, 2000 and 2010 for historical data; Institute of Policy Studies (IPS) 2011, Population Projections 2005–2050, Scenario 2 for 2015, 2030 and 2050.
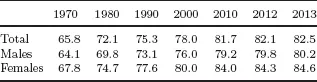
Table 1.1 Life Expectancy at Birth (Years).
Source: DOS, Population Trends 2014.
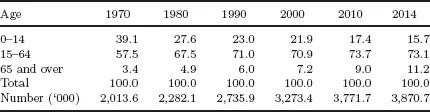
Table 1.2 Age Composition of Resident Population (%), 1970–2014.
Source: DOS, Population Trends 2014.
Conversely, total life expectancy at birth rose from 65.8 years in 1970 to 82.5 in 2013 (see Table 1.1), an impressive gain of over 16 years. Women at 84.6 years outlive men at 80.2 years by 4.4 years, making Singapore the fourth and the fifth in the world for best life expectancy for women and men respectively (World Health Organization [WHO], 2014). Life expectancy at age 65 also rose from only 8.4 years to 20.6 years (22 years for females, 18.8 years for males) over the same period (Ministry of Health [MOH], 2014c). With smaller cohorts of babies born and longer lifespans, the proportion of the young aged 0–14 years has declined while the proportion of the elderly aged 65 and older has risen considerably (see Table 1.2).
In spite of a continued below-replacement level fertility, the number and proportion of the population in the middle-age band, 15–64 years, typically referred to as the working age population, has continued to grow. This was primarily due to a more relaxed immigration policy implemented by the government in the 1980s in response to the declining birth rates. The immigration policy was further liberalised in the 1990s to attract foreign talent with skills and qualifications to augment the existing workforce (Yap, 2010). To date, foreign workers make-up approximately 1.3 million or 38% of the total labour force (Ministry of Manpower [MOM], 2014a). Such foreigners are encouraged to become permanent residents (PRs) and eventually citizens. The number of new PRs rose steadily over the years and reached its peak at 79,167 in 2008 while new citizenships was at 20,513. Thereafter, the influx of new PRs has been moderated to below 30,000 from 2010 to 2013 while new citizenships remained relatively stable, hovering around 19,000 per year over the same period (The National Population and Talent Division [NPTD], DOS, Ministry of Home Affairs [MHA] & Immigrations & Checkpoint Authority [ICA], 2014, p. 13).
The elderly in Singapore
Current elderly
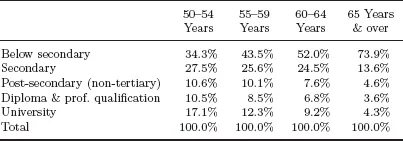
Preparation for an ageing population is a complex issue. A successful ageing policy takes into consideration not just the numerical aspects of ageing but also reflects an in-depth understanding of the elderly cohort in terms of their profiles and expectations. Different age cohorts brings with them distinct characteristics which in turn influence their outlook towards issues such as retirement, expectations of caregiving, etc. Other social determinants such as educational attainment, gender and ethnicity also play a part in influencing one’s ageing trajectory. Singapore’s current elderly generally have lower educational attainment compared to their younger cohorts (see Table 1.3). Due to the economic and social circumstances then, only 7.9% for those aged 65 years and over have tertiary qualifications compared to the younger age cohorts, where nearly one-third of those aged 50–54 years are tertiary educated. There is also a discrepancy between the male and female elderly in this area where 86.2% of female elderly reported below secondary qualifications compared to 71.3% of male elderly (DOS, 2011). These differences are likely to have an impact on their life-time employment, earnings and more importantly, their ability to adequately save for their retirement needs compared to their male counterparts (Yap & Kang, 2010).
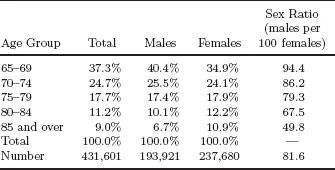
Not only has the elderly proportion grown but the elderly, as a group, are themselves getting older with longer life expectancy. Those in the age cohort 75 years and over have become a larger proportion of the elderly population, from slightly over 27.5% in 1980, to 37.9% in 2014 (DOS, 2014). There are also proportionately more women than men and this increases with each older age cohort, signifying a feminisation of ageing trend which is consistent with demographic trends elsewhere in the world (see Table 1.4).
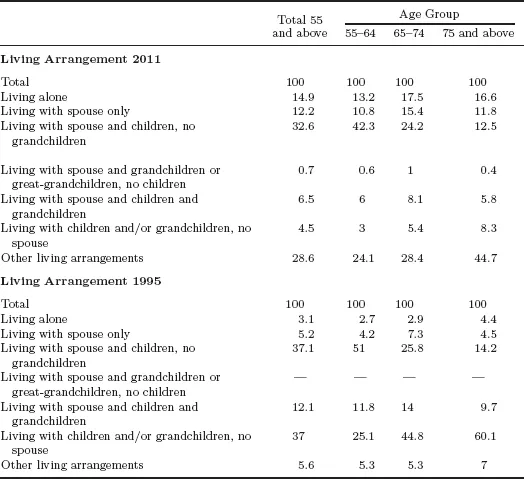
Almost all of Singapore’s current elderly have ever married. This has implications for old-age support, in particular, the availability of family members as informal caregivers. On a positive note, the current elderly have access to greater caregiving and financial support from their children as nearly half have had five or more children. As shown in Table 1.5, the National Survey on Senior Citizens (NSSC) 2011 revealed that a significant number of them (44.3%) are also living with their family members in varying combinations while 12.2% live with their spouses (Ministry of Social and Family Development [MSF], 2013, p. 19). However, comparisons across different time frames revealed significant changes in the living arrangements of the elderly. More elderly are living alone rising from 3.1% in 1995 to 14.9% in 2011. Other types of living arrangements such as living with friends, siblings or unrelated individuals also surged to 28.6% in 2011 from a mere 5.6% in 1995. This rise is even more prominent for those aged 75 and above, with an overall increase of 37.7% in 2011 when compared to 1995 (ibid., p. 22).
Table 1.3 Residents Aged 50 Years and over by Highest Qualifications Attained, Age Group, 2013.
Source: DOS, Population Trends 2014.
Table 1.4 Age Composition (%) and Sex Ratios.
Source: DOS, Population Trends 2014.
The NSSC 2011 showed that the majority of the elderly are still fairly independent. Specifically, 96% of them reported that they are ambulant and physically independent. This increased to 98% when those who are ambulant with a walking aid are included. In addition, the family is still a main source of support for the current elderly with 66.7% of the respondents citing income transfers from children as one of their main sources of income, which has not changed much from the 66% in 2005. As expected, those aged 75 and above received the highest level of support at 80.2%. The female elderly also tend to rely more on their children as 74.8% of them cited income transfers form their children compared to their male counterparts with 57.5% (MSF, 2011, p. 39).
Baby boomers
Despite the projected challenges anticipated with a rapidly ageing population, the picture seems less bleak when taking into consideration the profiles of the future elderly, namely, the baby boomers born immediately after World War II to 1964 and numbering approximately 900,000. According to Yap and Kang (2010), the baby boomers would have benefitted from the economic and social transformation that has characterised post-independence Singapore. Although there are some differences between the early and late baby boomers, those in this cohort, when compared to the current elderly, are generally better educated, hold higher skilled jobs and have greater real incomes. Gender differences remain but are narrowing. Additionally, the baby boomers differ from the currently elderly as more prefer independent living with their spouse. They are also less adverse to alternative living arrangements such as retirement villages and nursing homes. However, the sheer size of their numbers and better educational statuses could mean a greater political clout and a stronger influence over government policies on ageing.
Table 1.5 Living Arrangements of Those Aged 55 and above, 1995–2011.
Source: NSSC 2011.
Social issues arising from an ageing population
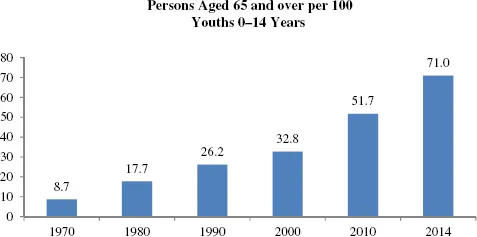
Much of the 1970s was devoted to assertive anti-natalist policies as a means to curb the burgeoning population that marked the first two decades following World War II. When it became clear that Singapore’s population growth was stagnating in the early 1980s, the Committee on the Problems of the Aged was convened in 1984 to study the effects of population ageing in Singapore. Since then, the discussion on Singapore’s major demographic shifts has steadily gained momentum. Policy-makers, demographers and academics alike delved deeper into the effects that an ageing society will have on healthcare, social security systems, future economic prosperity and political development. Demographers are interested in examining various summary indicators that describe and compare age structures of the population over time. The Ageing Index (see Figure 1.2) refers to the ratio of elderly aged 65 and over to the young aged 0–14 years. Whereas there were only 8.7 elderly per 100 youths in 1970, this figure has risen steadily to 71 in 2014. In other words, whereas there were more than 11 children to each elderly in 1970, this ratio has declined to fewer than two per elderly in 2014. This figure may be expected to decline further as low fertility continues. The Resident Old Age Support Ratio (see Figure 1.3) measures the number of working age population available (aged 20–64 years) to support each elderly (aged 65 years and over). This figure has also fallen by more than half from 13.5 per elderly in 1970, to 6 per elderly in 2014.
Fig. 1.2 Ageing Index, 1970–2014.
Source: Report on the State of the Elderly 2009 Release 1, MSF (2009) (based on Census 1970, 1980, 1990 and 2000) and DOS, Population Trends 2014.
The rising Ageing Index and declining Old-Age Support Ratio will have a tremendous impact on the availability of support for the growing aged population. More specifically, it will have implications on the size of those in the working age population, the middle-age band that powers the economy and provides support to young and old. This segment is projected to decl...