![]()
Chapter 1
Introduction
It is universally recognized that lifetimes of individuals, components, systems, etc. are unpredictable and random, and hence amenable only to probabilistic and statistical laws. The development of models and methods to deal with such random variables took place in the second half of the 20-th century, although certain explicit and implicit results are from earlier times as well. The development proceeded in two main intermingling streams. The reliability theory stream is concerned with models for lifetimes of components and systems, in the engineering and industrial fields. The survival analysis stream mainly drew inspiration from medical and similar biological phenomena. In this book we bring the two streams together. Our aim is to emphasise the basic unity of the subject and yet to develop it in its diversity.
In all the diverse application, the random variable of interest is the time upto the occurrence of the specified event often called “death”, “failure”, “break down” etc. It is called the lifetime of the concerned unit. However, there are situations where the technical term “time” does not represent time in the literal sense. For example, it could be the number of operations a component performs before it breaks down. It could even be the amount that a health insurance company pays in a particular case.
Examples of failure or lifetime situations:
| (1) | A mechanical engineer conducts a fatigue test to determine the expected life of rods made of steel by subjecting n specimens to an axial load that causes a specified stress. The number of cycles are recorded at the time of failure of every specimen. |
| (2) | A manufacturer of end mill cutters introduces a new ceramic cutter material. In order to estimate the expected life of a cutter, the manufacturer places n units under test and monitors the tool wear. A failure of the cutter occurs when the wear-out exceeds a predetermined value. Because of the budgeting constraints, the manufacturer runs the test for a month. |
| (3) | A 72-hr. test was carried out on 25 gizmos, resulting in r1 failure times (in hrs.). Of the remaining working gizmos on test r2 were removed before the end of test duration (72 hrs.) to satisfy customer demands. The rest were still working at the end of the 72-hr. test. |
| (4) | Leukemia patients: Leukemia is the cancer of blood and as in any other type of cancer, there are remission periods. In a remission period, the patient though not free of disease is free of symptoms. The length of the remission period is a variable of interest in this study. The patients in the state of remission are followed over time to see how long they stay in remission. |
| (5) | A prospective study of heart condition. A disease-free cohort of individuals is followed over several years to see who develops heart disease and when does it happen. |
| (6) | Recidivism study: A recidivist is a person who relapses into crime. In this study, newly released parolees are followed in time to see whether and when they get rearrested for another crime. |
| (7) | Spring testing: Springs are tested under cycles of repeated loading and failure time is the number of cycles leading to failure. Samples of springs are allocated to different stress levels to study the relationship between the lifetimes at different stress levels. At the lower stress levels failure times could be longer than at higher stress levels. |
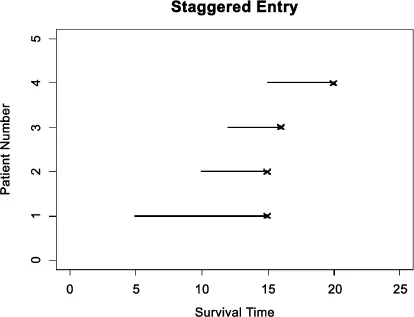
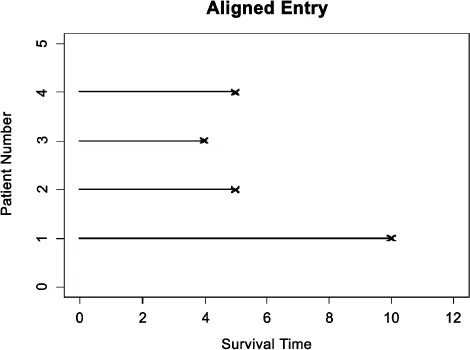
Measurement of Survival Time (or Failure Time): The following points should be kept in mind while measuring the survival time. The time origin should be precisely defined for each individual. The individuals under study should be as similar as possible at their time origin. The time origin need not be and usually is not the same calender time for each individual. Most clinical trials have staggered entries, so that patients enter the study over a period of time. The survival time of a patient is measured from his/her own date of entry. Figures 1.1 and 1.2 show staggered entries and how these are aligned to have a common origin.
Figure 1.1
Figure 1.2
The concept of the point event of failure should be defined precisely. If a light bulb, for example, is operating continuously, then the number of hours for which it burned should be used as the lifetime. If the light bulb is turned on and off, as most are, the meaning of number of hours burned will be different as the shocks of lighting and putting off decreases the light bulb’s life. This example indicates that there may be more to defining a lifetime than just the amount of time spent under operation.
Censoring: The techniques for reducing experimental time are known as censoring. In survival analysis the observations are lifetimes which can be indefinitely long. So quite often the experiment is so designed that the time required for collecting the data is reduced to manageable levels.
Two types of censoring are built into the design of the experiment to reduce the time taken for completing the study.
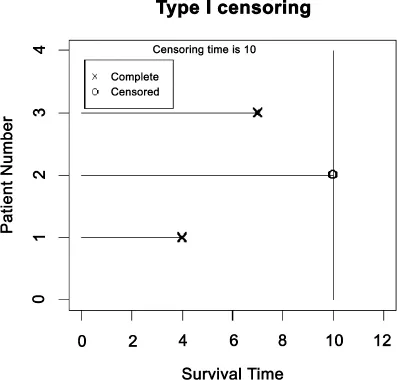
Type I (Time Censoring): A number (say n) of identical items are simultaneously put into operation. However, the study is discontinued at a predetermined time t0. Suppose nu items have failed by this time and the remaining nc = n − nu items remain operative. These are called the censored items. Therefore the data consists of the lifetimes of the nu failed items and the censoring time t0 for the remaining nc items (see Figure 1.3). Example of type I censoring
Power supplies are major units for most electronic products. Suppose a manufacturer conducts a reliability test in which 15 power supplies are operated over the same duration. The manufacturer decides to terminate the test after 80000 hrs. Suppose 10 power supplies fail during the fixed time interval. Then the remaining five are type I censored.
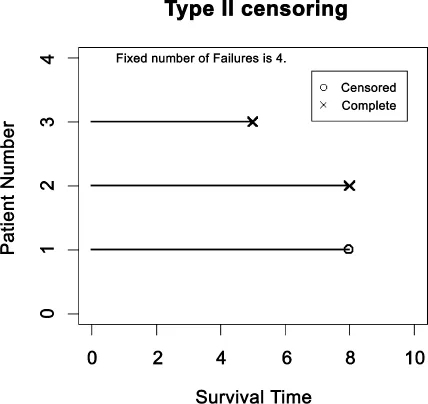
Type II (Order Censoring): Again a number (say n) of identical components are simultaneously put into operation. The study is discontinued when a predetermined number k(< n) of the items fail. Hence the failure times of the k failed items are available. These are the k smallest order statistics of the complete random sample. For the remaining items the censoring time x(k), which is the failure time of the item failing last, is available (see Figure 1.4).
Figure 1.3
Figure 1.4
Example of Type II censoring
Twelve ceramic capacitors are subjected to a life test. In order to reduce the test time, the test is terminated after eight capacitors fail. The remaining are type II censored.
The above types of censoring are more prevalent in reliability studies (of engineering systems). In survival studies (of biomedical items) censoring is more a part of the experimental situation rather than a matter of deliberate design.
Undesigned censoring occurs when some information about individual survival time is available but exact survival time is not known. As a simple example of such undesigned censoring, consider leukemia patients who are followed until they go out of remission. If for a given patient, the study ends while the patient is still in remission (that is the event defining failure does not occur), then the patient’s survival time is considered as censored. For this person, it is known that the survival time is not less than the period for which the person was observed. However, the complete survival time is not known.
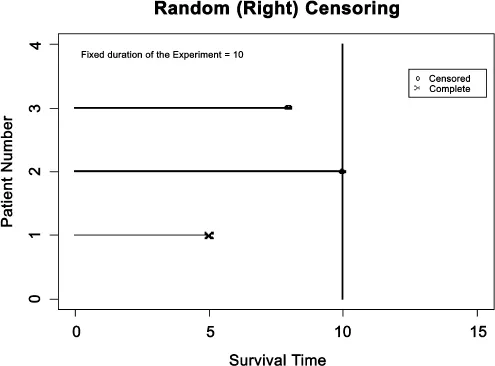
The most frequent type of censoring is known as right random censoring. It occurs when the complete lifetimes are not observed for reasons which are beyond the control of the experimenter. For example, it may occur in any of the following situations: (i) loss to follow-up; the patient may decide to move elsewhere and therefore the experimenter may not see him/her again, (ii) withdrawal from the study; the therapy may have bad side effects so it may become necessary to discontinue the treatment or the patient may become non-cooperative, (iii) termination of the study; a person does not experience the event before the study ends, (iv) the value yielded by the unit under study may be outside the range of the measuring instrument, etc. Figure 1.5 illustrates a possible trial in which random censoring occurs. In this figure, patient 1 entered the study at t = 0 and died at T = 5, giving an uncensored observation. Patient 2 also entered the study at t = 0 and was still alive by the end of study, thus, giving a censored observation. Patient 3 has entered the study at t = 0 but did not follow up before the end of study to give another censored observation.
Example of Random (right) Censoring
A mining company owns a 1,400 car fleet of 80-ton high-side, rotary-dump gondolas. A car will accumulate about 100,000 miles per year. In their travels from mines to a power plant, the cars are subjected to vibrations due to track input in addition to the dynamic effects of the longitudinal shocks coming through the couplers. As a consequence, the couplers encounter high dynamic impacts and experience fatigue failure and wear. Twenty-eight cars are observed, and the miles driven until the coupler is broken are recroded. The remaining six cars left service after 151000, 155000, 160000, 168000, 175000 and 178000 miles. None of them experienced a broken coupler. Thus giving randomly right censored data.
It may be noted that in type I censoring the number of failures is a random variable whereas in type II censoring the time interval over which the observations are taken is a random variable. In random censoring, the number of complete (uncensored) observations is random and time for which the study lasts may also be random. The censoring time for every censored observation in type I and II censoring is identical, but not so in random censoring. Furthermore, type I censoring may be seen to be a particular case of random censoring by taking all censoring times equal to t0.
Figure 1.5
Left censoring occurs less frequently than right censoring. It occurs when the observation (time for occurrence of the event) does not get recorded unless it is larger than a certain threshold which may or may not be identical for all observations. For example, the presence of certain gas cannot be measured unless it equals a threshold of six parts per million with a particular measuring device. Such data set will yield left-censored observations.
The data set may contain both left and right censored observations. A psychiatrist collected data to determine the age at which children have learned to perform a particular task. The lifetime was the time the child has taken to learn to perform the task from date of birth. Those children who already knew how to perform the task, when he arrived at the village were left censored and those who did not learn the task even by the time he departed were right-censored observations.
Interval censoring is still another type of censoring for which life time is known only to fall into an interval. This pattern occurs when the items are checked periodically for failure, when a recording instrument has lower as well as upper bounds on its measuring capacity etc.
A simple minded approach to handling the problem of censoring is to ignore all censored values and to perform analysis only on those items that were observed to fail. However, this is not a valid approach. If, for example, this approach is used for right censored data, an overly pessimistic result concerning the mean of the lifetime distribution will result since the longer lifetimes were excluded from the analysis. The proper approach is to provide probabilistic models for the censoring mechanism also.
The second chapter entitled ‘Ageing’ actually is concerning the development of various mathematical models for the random variable of lifetime. We assume it to be a continuous, positive valued random variable. We make a case for the exponential distribution as the central probability distribution, rather than the normal distribution which is accorded this prime position in standard statistical theory. We discuss various properties of the exponential distribution. The notions of no-ageing and ageing rightly act as indicators while choosing the appropriate law. Positive ageing describes in many ways the phenomenon, that a unit which has already worked for some time has less residual lifetime left than a similar new unit, whereas negative ageing describes the opposite notion. This chapter concerns with many such weak and strong notions and defines nonparametric classes of probability distributions characterised by them. Starting with the exponential distribution as the sole no-ageing distribution, we go on to define Increasing Failure Rate (IFR), Increasing Failure Rate Average (IFRA) and larger classes of distributions and their duals and discuss the properties of these classes. We also introduce the notion of a coherent system of components and show that the lifetime of such a system tends to have a distribution belonging to the IFRA class under fairly general positive ageing conditions on the components. We round off this chapter by providing ...