![]()
Chapter 1
Don’t Read University Rankings Like Reading Football League Tables: Taking a Close Look at the Indicators
Currently, there are three major global university ranking systems: the Academic Ranking of World Universities (ARWU), the (QSWUR) and the (THEWUR).
The ARWU started in 2003 at the Shanghai Jiaotong University, the People’s Republic of China. It compares 1,200 higher education institutions worldwide. According to the originators (Liu and Cheng, 2005; Liu et al., 2005), the purpose was to find out what makes university excellence. Implicitly, the aim was to qualitatively describe the contributing factors, while ranking was only a natural consequence of amassing information from a large number of universities from over the world. As it turns out, the purposes have reversed their precedence such that rankings seem to have become the main if not sole concern of universities everywhere.
Then, in 2004, the QSWUR was conceived independent of the ARWU as a follow-up of the 2003 review of the collaborative relationship between British universities and industries. The QSWUR ranks the world’s top 500 universities. The results are published in collaboration with Times Higher Education. Although QSWUR started as a national agenda to help British universities assess their relative standings in a worldly (no pun, please) context, universities of other nations were included; this gave the system a global orientation and ranking was an expressed desire, thus heightening global competitiveness.
As the QSWUR was criticized on conceptual grounds as favoring natural and physical sciences and thus having a bias against humanities, the Times Higher Education changed partner and produced in 2009 its own rankings, the THEWUR, using a new set of indicators with its first ranking results released in 2010. As would be expected, when a new set of indicators are used, rankings of the universities change, sometimes drastically. For instance, the Nanyang Technological University, Singapore ‘dropped’ 100 positions from the 2009 QSWUR list when compared with that in the 2010 THEWUR list (The Straits Times, 2010).
Sensitivity of University Rankings
Results of rankings are published with the universities in one column and their respective rankings in another, accompanied by the overall scores in descending order. This resembles a football league table and is always read like one. Then, a typical response is to ask ‘Where do we stand?’ and in asking such a question, it appears that rank is the only thing counts, like finding out where a favorite football team stands in a league table. The way academic league tables are read as if they were football league tables is vividly illustrated by the three examples below from different parts of the world:
‘The Australian National University has pipped Stanford and Michigan, and comfortably beaten the best universities of France, Germany and China, to grab 16th place (holding onto to its 2007 ranking) in this year’s Times Higher Education world university rankings … Unfortunately the other 6 Australian Universities ranked inside the World’s Top 100 lost ground on their ranking from last year’ (Australia Universities Rankings; emphases added).
‘The Ruperto Carola was able to successfully defend its top position among German universities and its role as a leading European institution in 2010: The three most significant international university rankings have all ranked Heidelberg University among Germany’s top three institutions and the world’s top 100 universities for its superior academic quality and research achievements’ (Heidelberg University in International Comparison; emphases added).
‘Vice-Chancellor (VC) University of Karachi (KU) Prof Pirzada Qasim has congratulated the students and teachers of the university on the 569th rank out of the 1,000 top world universities … In a message to the faculty and the students, the VC expressed his pleasure over achieving this laurel and urged the stakeholders of the university to work with the missionary zeal to enable the university to gain better rankings in the future’ (KU Stands 569th in World Ranking; emphases added).
The keen competitiveness normally found in reading football leagues tables is well illustrated by the emotional language used in the cited responses. Attention to the complex qualitative aspects of academic excellence seems to have been overridden by the apparently simple single numbers of quantitative description of relative rankings. However, as will be made clear, academic leagues tables are not to be read as if they were football league tables. There are important differences between them.
A typical football league table shows the names of the teams and their standings based on points or percentage of games won. In addition, some other information such as wins, losses, ties, goal differential, etc. may be presented, but they do not constitute part of the final rankings and are only ancillary. On the other hand, an academic league table shows the names of universities and their relative ranks based overall scores (and the similarity to a football league table stops here) which are composites of sub-scores for indicators arguably reflective of the academic quality of the universities. In other words, the indicators’ sub-scores used for university rankings are contributing components of the overall score and not independent of it.
That being the case, users of football league tables can afford to ignore the ancillary information and just focus on the final ranking. Doing so makes sense because the standings are based on the numbers of goals which cannot come in any other way but the numbers of goals scored. This is not the case for academic rankings. The overall scores on which universities are ranked are based on combinations of various indicator sub-scores; and the same overall scores can result from different combinations, making the interpretation of the same overall scores (and hence the same ranks) problematic. Moreover, as shown below, different academic ranking systems use different indicators and this not only complicates the interpretation of rankings but also renders rankings from different systems in comparable.
Indicators for Ranking
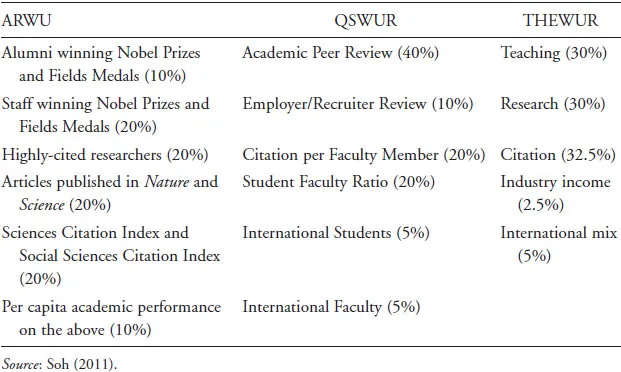
Table 1 shows the indicators used by the three university ranking systems. Clearly, ARWU has a very strong emphasis almost exclusively on the external environment of the university, basing the ranking on Nobel and field awards, staff publication, and citation in reputable journals. Even its last indicator is derived from the earlier ones, thus giving further emphasis on external evaluation of achievement already covered.
Compared with the ARWU, the QSWUR does not only pay attention to academic achievement but also considers a university’s external condition — of the employment of graduates — and internal organizational conditions such as student/faculty ratio and proportions of international mix of both students and staff. This seems to reflect better the modern characteristics of universities’ dual functions in both research and teaching as well as the trend of globalization of higher education.
Table 1. Indicators of the Three University Systems.
The THEWUR, as a new player in the university ranking game, shows an attempt to balance the three critical aspects of a university’s function, namely, teaching, research, and publication. Besides, it also takes due cognisance of the trend of globalization of higher education today.
It is obvious from Table 1 that all three systems use multiple indicators, six in ARWU and QAWUR but five in THEWUR. Besides the different nature and emphasis as described above, several points common to all three systems are worthy of note. First, the various indicators are given certain weights; the weights presumably are indicative of the indicators’ relative importance as perceived by the designers of the systems. Second, the various indicators are discrete entities; that is to say, they are supposedly independent of one another. And, third, the total score is a combination of the indicators’ weighted scores; this assumes that the indicators are mutually interchangeable or at least mutually compensatory, that is to say, weaknesses in one indexed aspect can be made good by strengths in the others.
Granted that choice of indicators and the relative weighting of them have been rationalized, several questions can be asked. These are questions usually not asked about football league tables because of the straightforwardness of the football measure (e.g., goals scored or matches won). However, such questions should not be ignored when reading academic league tables because of the complexity of academic excellence and the method by which the overall score is derived for final ranking. The questions are as follows:
To what extent do indicators within a particular academic ranking system correlate?
Are the assigned weights actually attained in the ranking systems?
When indicators are correlated, which is the most powerful one contributing the most to the overall score?
And, How do the additional ones contribute to the overall score?
This article illustrates how the above questions may be answered by using data available in the public domain on the systems’ respective websites, namely, the ARWU’s (2010) top 100 universities, the QS system’s rankings of the top 200 universities for the year 2008 (Times Higher Education, 2008), and the THEWUR 2010 rankings for the top 200 universities (Times Higher Education, 2011).
Correlations Among Indicators
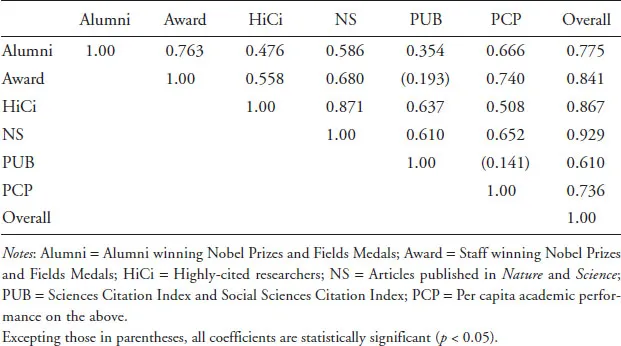
The first question asks about the correlations among indicators within systems. Table 2 presents the inter-correlations among the ARWU indicators and overall scores. Correlations of indicator scores with the overall score are shown in the rightmost column. It is obvious that all coefficients are sizable, varying from 0.61 (PUB) to as high as 0.93 (NS). More importantly, all but two of the possible 15 correlation coefficients among the indicators are statistically significant. The significant coefficients vary from 0.35 (Alumni and PUB) to 0.87 (HiCi and NS), indicating shared variance of 12% (between alumni winning/medals and citation) to as much as 76% (between highly cited researchers and publication in Nature and Science). The median of the coefficients is 0.65 indicating that there is a shared variance of 42%, on average, among the six indicators. These suggest that there are indeed redundant indicators among the six.
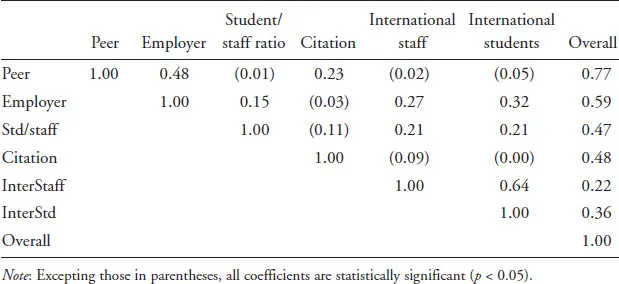
Table 3 shows the inter-corrections among the six QSWUR indicators. First of all, all indicators have statistically significant correlation with the total score (Overall). These seem to suggest that all indicators contribute to overall score substantially. The coefficients vary from a low 0.22 (International Staff) to a high 0.77 (Peer), indicating that the indicators contributed between as little as 5% to as much as 59% to the overall score. It is also of note that the correlation between Peer and Employed is 0.48, indicating a 23% shared variance. Likewise, International Staff and International Students correlate with a coefficient of 0.64, indicating 41% shared variance. These sizable correlations suggest that there may be redundancy in the indicators, meaning one in each correlating pair may be omitted for parsimony.
Table 2. Correlations among ARWU Indicators.
Table 3. Correlations among QSWUR Indicators.
Table 4 shows the inter-corrections among the five THEWUR indicators. First, all indicators correlate with statistical significance with the overall score, suggesting that they all contribute to overall score substantially. The coefficients vary from a low 0.16 (International mix) to a high 0.85 (Teaching). These indicate that the indicators contributed between as little as 3% to as much as 73% to the overall score. It is also of note that the correlation between Peer and Employed is 0.48, indicating a 23% shared variance. At the same time, the high correlation of 0.85 b...