Expect the Unexpected
eBook - ePub

Expect the Unexpected

A First Course in Biostatistics

Raluca Balan, Gilles Lamothe;;;

Share book
  1. 316 pages
  2. English
  3. ePUB (mobile friendly)
  4. Available on iOS & Android
eBook - ePub

Expect the Unexpected

A First Course in Biostatistics

Raluca Balan, Gilles Lamothe;;;

Book details
Book preview
Table of contents
Citations

About This Book

-->

This textbook introduces the basic concepts from probability theory and statistics which are needed for statistical analysis of data encountered in the biological and health sciences. No previous study is required. Advanced mathematical tools, such as integration and differentiation, are kept to a minimum. The emphasis is put on the examples. Probabilistic methods are discussed at length, but the focus of this edition is on statistics.

The examples are kept simple, so that the reader can learn quickly and see the usefulness of various statistical and probabilistic methods. Some of the examples used in this book draw attention to various problems related to environmental issues, climate change, loss of bio-diversity, and their impact on wildlife and humans.

In comparison with the first edition of the book, this second edition contains additional topics such as power, sample size computation and non-parametric methods, and includes a large collection of new problems, as well as the answers to odd-numbered problems. Several sections of this edition are accompanied by instructions using the programming language R for statistical computing and graphics.

-->

Request Inspection Copy


--> Contents:

  • Probability:
    • Introduction to Probability
    • Axioms of Probability
    • Conditional Probability
    • Discrete Random Variables
    • Continuous Random Variables
    • Supplementary Problems (Probability)
  • Statistics:
    • Introduction to Statistics
    • Confidence Intervals
    • Hypothesis Testing
    • Comparison of Two Independent Samples
    • Paired Samples
    • Categorical Data
    • Regression and Correlation
    • Supplementary Problems (Statistics)
  • Additional Topics:
    • Sample Size and Power
    • Non-Parametric Methods
    • Answers to Odd-Numbered Problems
    • Tables

-->
--> Readership: Undergraduates studying probability and statistics, especially in the life and natural sciences. -->
Probability Theory;Statistical Inference;Biostatistics;Statistics;Calculus-Based Statistics;Genetics;Biology;Ecology;Health;Life Sciences;Natural Sciences Key Features:

  • This edition contains a large collection of new problems and includes the answers to odd-numbered problems
  • Several sections of the book are accompanied by a technology component containing instructions using the programming language R for statistical computing and graphics
  • Although probabilistic methods are discussed at length in the book, the focus of this edition is on statistics, with a new chapter dedicated to non-parametric methods in statistics

Frequently asked questions

How do I cancel my subscription?
Simply head over to the account section in settings and click on “Cancel Subscription” - it’s as simple as that. After you cancel, your membership will stay active for the remainder of the time you’ve paid for. Learn more here.
Can/how do I download books?
At the moment all of our mobile-responsive ePub books are available to download via the app. Most of our PDFs are also available to download and we're working on making the final remaining ones downloadable now. Learn more here.
What is the difference between the pricing plans?
Both plans give you full access to the library and all of Perlego’s features. The only differences are the price and subscription period: With the annual plan you’ll save around 30% compared to 12 months on the monthly plan.
What is Perlego?
We are an online textbook subscription service, where you can get access to an entire online library for less than the price of a single book per month. With over 1 million books across 1000+ topics, we’ve got you covered! Learn more here.
Do you support text-to-speech?
Look out for the read-aloud symbol on your next book to see if you can listen to it. The read-aloud tool reads text aloud for you, highlighting the text as it is being read. You can pause it, speed it up and slow it down. Learn more here.
Is Expect the Unexpected an online PDF/ePUB?
Yes, you can access Expect the Unexpected by Raluca Balan, Gilles Lamothe;;; in PDF and/or ePUB format, as well as other popular books in Matemáticas & Probabilidad y estadística. We have over one million books available in our catalogue for you to explore.

Information

Publisher
WSPC
Year
2017
ISBN
9789813209084

PART 2

Statistics

Chapter 7

Introduction to Statistics

Statistics is one of the oldest disciplines in science, whose origins can be traced back to the 17th century when the British administration needed a tool for analyzing various demographic and economical data. The scope of the discipline became larger in the 19th century to include the analysis of data in general. Today, statistics is employed by people working in diverse fields, like economics, engineering, social sciences, and natural sciences.
In this chapter, we discuss several methods for analyzing data, using numerical summaries and graphical tools. We emphasize the distinction between a population and a random sample from a population. We explain how a random sample can be used to estimate population parameters, and discuss ways to measure the estimation error. Finally, we end this chapter with a discussion on the sampling distribution of estimators. We also give the Central Limit Theorem which states that the distribution of a sample mean can be approximated by a normal distribution.

7.1 Random Sampling and Data Description

In this section, we learn to describe data using numerical summaries (called descriptive statistics) and graphical representations. We consider the data as observations from a random variable. The set of these observations is called a random sample. The techniques that we use to describe the sample depend on the variable type.
If the values of the variable represent categories, then we say that the variable is categorical. The table below contains examples of categorical variables.
Variable Categories
color of pea pod yellow, green
type of fish Northern pike, Rainbow trout, Catfish
height small, medium, large
A variable is called quantitative (or numerical) if it represents a numerical quantity. Temperature (in Kelvin), surface area in (cm2), volume (in m3), height (in cm), and number of diseased individuals, are examples of quantitative variables.
For categorical variables an easy and effective way to describe the data is to display a frequency distribution or a relative frequency distribution. When defining the categories one has to be careful in defining mutually exclusive classes, otherwise the relative frequencies do not add up to 1. The (relative) frequency distribution can be displayed as a table, or graphically, as a bar chart.
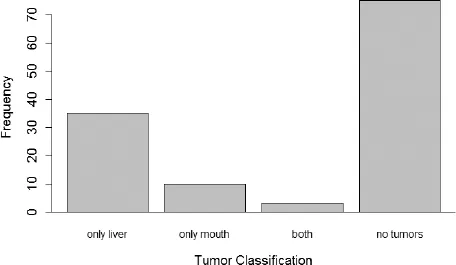
Example 7.1. A fish tumor survey was conducted in a particular river system. Of particular interest were liver tumors and tumors in the mouth. A random sample of n = 123 fish were captured, classified and released. The frequency distribution is displayed below in tabular form and as a bar chart in Figure 7.1.
Tumor Classification
Frequency
Relative Frequency
only liver
35
28.5%
only mouth
10
8.1%
both
3
2.4%
no tumors
75
61.0%
Total
123
100%
Many biological studies are comparative in nature. These studies usually involve two or more variables. In the case of two categorical variables, we can start by cross-classifying the observations according to the joint categories of the two variables. The resulting table is called a contingency table and it displays the joint (relative) frequency distribution of the two variables.
To describe the association between the two variables, we can compute conditional relative frequency distributions for one of the variables conditioned on the categories of the other variables. The conditional relative frequency distribution can be displayed as a side-by-side bar chart.
images
Fig. 7.1 Distribution of fish tumors
Example 7.2. Consider a fish tumor survey similar to Example 7.1. We would like to compare the fish tumor distributions in two river systems. A summary of the data is found in the following contingency table, which is a cross-classification of the fish according to the tumor category and the river systems. Each cell represents a joint frequency. In the parenthesis, we computed the conditional relative frequency for the tumour variable conditioned on the river system.
images
In Figure 7.2, we find a side-by-side bar chart of the conditional distributions for tumor. The distribution of tumors do appear to be heterogeneous. In fact, it appears that fish from the second river system are more likely to have no tumors.
The frequency distribution is an important tool to describe the random sample from a quantitative variable. The frequency distribut...

Table of contents