![]()
Chapter 1
Introduction to Probability and Statistics
Abstract: Probability perhaps has become the best analytic tool to describe any system involving uncertainties, and statistics provides a mathematical foundation to model situations involving uncertainty. As the beginning of this book, this chapter will introduce two fundamental axioms behind modern econometrics, emphasizes the important role of statistics in economics and also discusses the limitation of statistical analysis in economics.
Key words: Chaos, Data generating process, Econometrics, Quantitative analysis, Probability law, Uncertainty.
1.1 Quantitative Analysis in Economics
The most important feature of modern economics and finance is the wide use of quantitative analysis. Quantitative analysis consists of mathematical modeling of economic theory and empirical study of economic data. This is due to the cumulative effort of many generations of economists to make economics a science, something like or close to physics, chemistry and biology, which can make accurate predictions or forecasts. Economic theory, when formulated via mathematical tools, can achieve its logical consistency among assumptions, theories, and its implications. Indeed, as Karl Marx points out, the use of mathematics is an indication of the mature stage of a science. On the other hand, for any economic theory to be a science, it must be able to explain important empirical stylized facts and to predict future economic evolutions. This requires validating economic models using the observed economic phenomena, usually in form of data. Mathematical tools alone cannot achieve this objective. Instead, statistical tools have proven to be rather useful. The history of the development of economics is a continuous process of refuting the existing economic theory that cannot explain new empirical stylized facts and developing new economic theories that can explain new observed empirical stylized facts. Empirical analytic tools play a vital role in such a process. In a sense, statistical methods and techniques are really the heart of the scientific research in economics.
As a matter of fact, the main empirical analytic tool in economics is econometrics. Econometrics is the statistical analysis of economic data in combination with economic theory. There is a lot of uncertainty in real economies and financial markets, and economic agents usually have to make decisions under uncertainty. Probability is a natural quantitative tool to describe uncertainty in economics. Historically, probability was motivated by interest in games of chance. Scholars then began to apply probability theory to actuarial problems and some aspects of social sciences. Later, probability and statistics were introduced into physics by L. Boltzmann, J. Gibbs, and J. Maxwell, and by last century, they had found applications in all phases of human endeavor that in some way involve an element of uncertainty or risk. Indeed, probability theory has become the best analytic tool to describe any system involving uncertainty.
Modern statistics has encompassed the science of basing inferences on observed data and the entire problem of making decisions in the face of uncertainty. It would be presumptuous to say that statistics, in its present state of development, can handle all situations involving uncertainty, but new techniques are constantly being developed and modern statistics can, at least, provides a framework for looking at the situations involving uncertainty in a logical and systematic fashion. It can be said that statistics provides mathematical models that are needed to study situations involving uncertainty in the same way as calculus provides mathematical models that are needed to describe, say the concepts of the Newtonian physics. Indeed, as Robert Lucas points out, the introduction of stochastic factors into a dynamic economic system can provide new insight into dynamic economic laws.
1.2 Fundamental Axioms of Statistical Analysis in Economics
There are two fundamental axioms behind modern econometrics:
• Axiom A: Any economy can be viewed as a random or stochastic system governed by some probability law;
• Axiom B: Economic phenomenon, often summarized in form of data, can be viewed as a realization of this stochastic data generating process.
Economics is about resource allocation in an uncertain environment. When an economic agent makes a decision, he or she usually does not know precisely the outcome of his or her action, which usually will arise in an unpredictable manner with time lags. As a consequence, uncertainty and time are two of the most important features of an economy. Therefore it seems reasonable to assume Axiom A. With Axiom A, it is natural to assume Axiom B under which one can call the economic system a “data generating process”. It is impossible to prove these two axioms. They are the philosophic views of econometricians and economists about an economy. We note that not all economists may agree with these two axioms. For example, some economists view that an economic system is a chaotic process, which is deterministic but can generate seemingly random numbers.
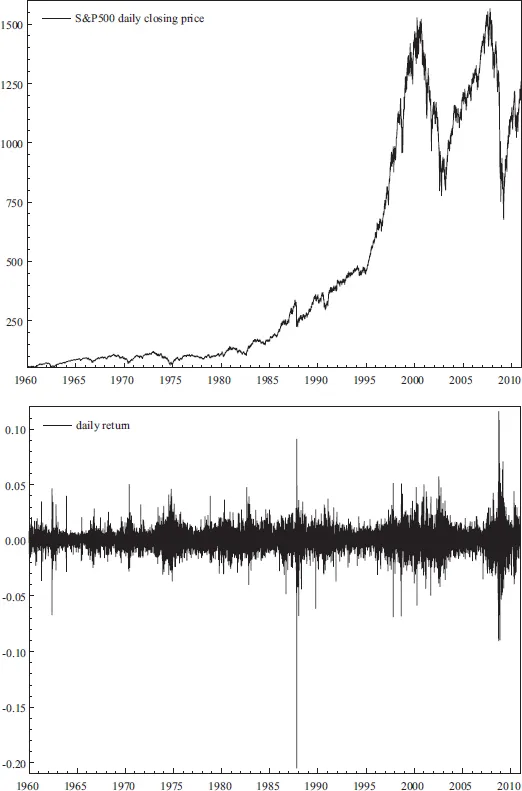
To illustrate the different implications between a stochastic view and a chaotic view on an economy, we consider an example. As a well-known empirical stylized fact, high frequency stock returns are found to have little autocorrelation with their own lagged returns. Figure 1.1 plots the observations on the Standard & Poor 500 daily closing price and daily return over time respectively. To explain this empirical stylized fact, there are at least two possible hypotheses or conjectures. The first is to assume that the stock price follows a geometric random walk, that is,
where its log-return series {Xt = ln(Pt/Pt−1)} is a statistically independent sequence over time, which implies zero correlation between stock returns over time. Figure 1.2 plots the observations on the price level Pt and the return Xt generated from this geometric random walk model using a random number generator on a personal computer. Comparing Figures 1.1 and 1.2, we can observe some similarity between the real data series and the artificial series generated from the computer.
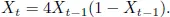
Alternatively, one may assume that the stock return follows a deterministic chaotic logistic map:
If we generate a large set of observations from this logistic map and calculate the sample autocorrelations between observations over time, we would also find zero or little correlations. Thus, both the stochastic random walk hypothesis and the deterministic logistic map hypothesis can explain the empirical stylized fact of zero or little autocorrelation in high-frequency stock returns. However, their implications are different: the random walk hypothesis implies that the future stock return is not predictable using historical stock returns, because a future stock return is independent of historical stock returns. On the other hand, the time series observations from a logistic map display zero autocorrelation, but they are not independent over time. In fact, there exists a deterministic nonlinear quadratic relationship between Xt and Xt−1 from which one can predict Xt perfectly using Xt−1. Which view is more realistic to explain stock returns is an issue for empirical study.
Figure 1.1: Standard & Poor 500 daily closing prices and daily returns
Figure 1.2: Price series Pt and return series Xt
The probability law of a stochastic economic process describes the average behavior of massive economic phenomena and may be called the “law of economic motions”. The objective of econometrics is to infer the probability law of an economic system based on observed economic data, and then use the inferred probability law to test economic theory and economic hypotheses, to explain important economic stylized facts, to forecast future evolutions of the economic system, and to conduct other applications such as policy analysis. Econometrics provides a bridge linking economic models and economic reality.
One important implication of Axioms A and B is the need of “stochastic thinking” and “statistical thinking” in economic analysis. For example, one should expect that economic relationships are stochastic and thus the outcomes cannot be predicted with certainty. All economic agents must incorporate this uncertainty when making their economic decisions. Moreover, any observed economic data, as realizations of a stochastic process, must be subject to sampling variations, thus creating some uncertainties for inference of the law of economic motions.
1.3 Role of Statistics in Economics
As a science, statistics has been widely applied in many different fields, including physics, engineering, economics, finance, management, biology, medical science, public health, and many others. For example, statistical quality control has been a very successful application of statistical methods to quality control in manufacture industries in Japan and the United States. The objective of statistical quality control is to monitor the process of production and decides whether the production is in-control or out-of-control by setting some control limits. The idea of control limits is analogous to that of hypothesis testing in statistics.
Below, we briefly discuss what roles statistics can play in economics and related fields.
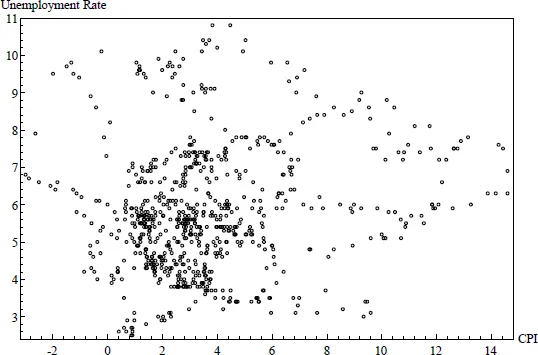
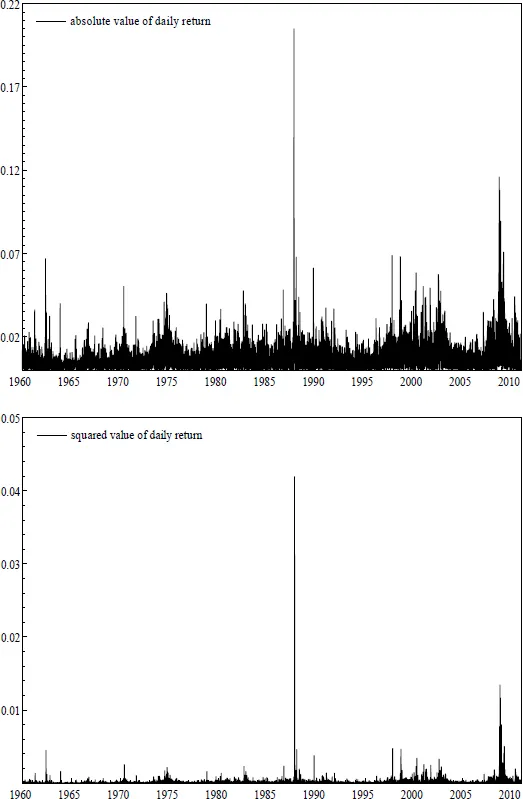
First of all, economic phenomena is usually rather complicated, and there is a vast amount of information in daily economic life. It is very important to summarize observed economic data in a simple, intuitive and interpretable way so as to convey information to economists, decision makers, and the public. Statistics, by its very nature, is an effective tool for doing so. Economic indicators such as the Consumer Price Index (CPI) and the unemployment rate are two examples of statistical description of the state of an macroeconomy which have been indispensable means for governments and central banks to decide their fiscal and monetary policies. Moreover, many important empirical stylized facts in economics are presented in form of a statistical relationship. One example is the well-known Phillips curve in macroeconomics, which documents that the inflation rate is negatively correlated with the unemployment rate. Figure 1.3 is a scatter plot of the U.S. inflation rate, the log-difference of the U.S. CPI series, and the U.S. unemployment rate, which indicates a negatively correlated relationship. Another example is volatility clustering in finance, which documents that a large asset volatility today tends to be followed by another large volatility tomorrow; a small volatility tends to be followed by another small volatility tomorrow, and the patterns alternate over time. Figure 1.4 plots the time series observations of the absolute and squared values of the Standard & Poor 500 daily return. They indicate the phenomena of volatility clustering. Concepts in probability and statistics can also provide simple characterizations of economic ideas and economic theory. Examples include the Lorenz curve of income inequality and the representation of stochastic dominance via the probability distribution function. In fact, most financial theory is represented with the concepts of probability. It would be difficult to imagine what will be left in modern finance if there is no use of probability concepts and tools.
Second, a key feature of economic data is the existence of variability in economics. Much of variability is due to inherent uncertainty in the economy, which results in risk given the risk-averse nature of economic agents. A central theme of modern financial risk management is to quantify and price financial risk via statistical methods and modeling. For such purposes, statistical models and measures of volatility are indispensable quantitative tools.
Third, an ingredient methodology in statistics is sampling. The basic idea of sampling theory is to use a subset of information called “sample” to infer knowledge of the entire system or process called “population”, and then use the knowledge of the system for various applications. This statistical method is consistent with the economic principle of cost minimization. An example is the aforementioned stochastic quality control, which uses a similar idea to hypothesis testing to ensure the quality of manufactured products while minimizing the cost of inspection and monitoring.
Fourth, perhaps the most important objective of economic analysis is to discover or validate economic relationships, particularly causal economic relationships. Statistical inference can play an instrumental role in this regard. For example, statistics can estimate demand elasticities of output with respect to price for certain product, which may be useful for the marketing strategy of a company. Combined with well-designed experiments which can control important economic factors, statistical analysis can identify causal economic relationships. On the other hand, for observational or historical economic data for which economists cannot control economic factors, it is much more challenging if not impossible to identify causal economic relationships. Nevertheless, aided with economic theory, statistics can be still very helpful in identifying economic relationships.
Figure 1.3: Scatter plots of the U.S. inflation rate and unemployment rate
Figure 1.4: Absolute and squared values of the Standard & Poor 500 daily return
Fifth, economic agents often m...