![]()
Chapter 1
Fault Diagnosis
Fault diagnosis is useful in helping technicians detect, isolate, and identify faults, and troubleshoot. Bayesian network (BN) is probabilistic graphical model that effectively deals with various uncertainty problems. This model is increasingly utilized in fault diagnosis. This chapter presents bibliographical review on the use of BNs in fault diagnosis in the last decades with focus on engineering systems. This work also presents the general procedure of fault diagnosis modeling with BNs; processes include BN structure modeling, BN parameter modeling, BN inference, fault identification, validation, and verification. The chapter provides series of classification schemes for BNs for fault diagnosis, BNs combined with other techniques, and domain of fault diagnosis with BN. This study finally explores current gaps and challenges and several directions for future research.
1.1.Introduction
With the rapid development of modern industrial systems, systematic complexity increases constantly. Therefore, fault diagnosis must be utilized to obtain high reliability and availability. Fault diagnosis quickly detects process abnormality and component fault and identifies root causes of these failures by using appropriate models, algorithms, and system observations. Therefore, fault diagnosis system is useful in assisting operations staff to detect, isolate, and identify faults and to aid in troubleshooting.
In general, fault diagnosis approaches can be classified into three categories: model-based [1, 2], signal-based [3–5], and data-driven approaches [6–8]. In model-based approach, the focus is on establishing mathematical models of complex industrial systems. These models can be constructed by various identification methods, physical principles, etc. Signal-based approach uses detected signals to diagnose possible abnormalities and faults by comparing detected signals with prior information of normal industrial systems [9]. Usually, difficulty occurs in building accurate mathematical models and obtaining accurate signal patterns for complex industrial and process systems. Data-driven fault diagnosis approach requires a large amount of historical data, rather than models or signal patterns [10]. Therefore, data-driven methods are suitable for complex industrial systems.
The data-driven fault diagnosis approach is also called knowledge-based fault diagnosis approach. Knowledge information can be obtained based on either statistical or nonstatistical approach. The data-driven approach can be categorized into statistics-based and nonstatistics-based fault diagnosis approaches [10]. The former includes principal component analysis [11, 12], partial least squares [13, 14], independent component analysis [15, 16], and support vector machine [17, 18], whereas the latter includes neural network [19, 20], fuzzy logic [21, 22], etc.
BN is an important probabilistic graphical model, which can deal effectively with various uncertainty problems based on probabilistic information representation and inference. As a representational tool, BN is quite attractive for three reasons. First, BN is consistent and completely represents and defines unique probability distribution over network variables. Second, the network is modular; its consistency and completeness are ensured using localized tests, which are only applicable to variables and their direct causes. Third, BN is a compact representation, as it allows specification of exponentially sized probability distribution using polynomial of probabilities [38]. Hence, this tool is deeply researched and widely used in many domains ranging from reliability engineering [24–28, 82], risk analysis [29–31], and safety engineering [32, 33] to resilience engineering [34–36].
During the last decades, BNs are studied and utilized in the domain of fault diagnosis, which is typically a data-driven approach. BN-based fault diagnosis models are established using huge amount of historical data. Diagnosis is conducted by backward analysis with various algorithms [37]. That is, we input observed information into evidence nodes, update posterior probabilities of fault nodes based on BN inference, and identify root causes of failure using identification rules. This research attracted considerable attention, solved some important problems of BN-based fault diagnosis, and focused on challenging problems. A large number of literatures, including theory research and project application, were conference proceedings and technical reports. To our knowledge, literature never reviewed use of BNs in fault diagnosis.
This chapter aims to review latest research results of BN-based fault diagnosis approaches to provide reference and to identify future research directions for fault diagnosis researchers and engineers. The remainder of the chapter is organized as follows. Section 1.2 provides an overview of BNs. Section 1.3 presents general procedures of fault diagnosis with BNs. Section 1.4 introduces types of BNs for fault diagnosis; these types include BNs, dynamic Bayesian networks (DBNs) and object-oriented Bayesian networks (OOBNs). Section 1.5 reviews domains of fault diagnosis with BNs. Section 1.6 identifies a few on-going and upcoming research directions. Section 1.7 summarizes this chapter.
1.2.Overview of BNs
BN is a probabilistic graphical model representing a set of random variables and their conditional dependencies via a directed acyclic graph. Such a network consists of qualitative and quantitative parts. The qualitative part is a directed acyclic graph, in which nodes represent system variables, whereas arcs symbolize dependencies or cause-and-effect relationships among variables. The quantitative part consists of the conditional probabilistic table, which represents the relationship between each node and its parents. In BNs, leaf nodes only have parent nodes but no child nodes, and root nodes have child nodes but no parent nodes [23].
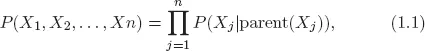
Let us consider n random variables X1, X2, . . . , Xn, a directed acyclic graph with n numbered nodes, and suppose node j (1 ≤ j ≤ n) of the graph is associated to Xj variable. The graph is a BN, representing variables X1, X2, . . . , Xn in the following equation:
where parent (Xj) denotes set of all variables Xi; such an arc connects node i to node j in the graph [131].
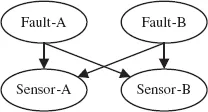
Fig. 1.1. A simple BN-based fault diagnosis model.
Then, let us use an example. Suppose that two faults, Fault-A, Fault-B or both, could affect the sensor’s reading, Sensor-A, Sensor-B or both. Suppose that each fault has two states, which are present and absent, and each fault symptom obtained from sensor data has three states, which are higher, lower and normal. The situation can be modeled with BN, as shown in Fig. 1.1.
This model can be used to diagnose the faults, Fault-A and Fault-B, by using the sensor’s data, Sensor-A and Sensor-B.
1.3.Procedures of Fault Diagnosis with BNs
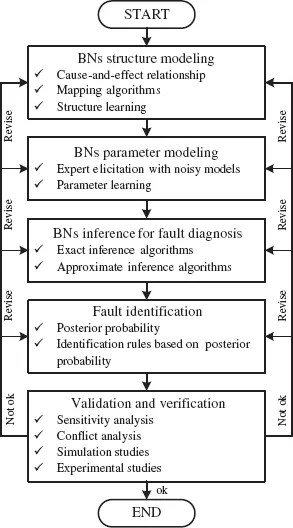
Fault diagnosis procedures with BNs consist of BN structure modeling, BN parameter modeling, BN inference, fault identification, and validation and verification. Figure 1.2 provides a detailed flowchart of the process. BN-based fault diagnosis model can be established following the proposed five steps: (1) structure model of BNs for fault diagnosis can be established by using cause-and-effect relationship, mapping algorithms, or structuring learning method; (2) parameter model of BNs can be established by using expert elicitation with noisy models and parameter learning method; (3) exact or approximated inference algorithms can be conducted for BNs inference; (4) system faults can be identified by directly using posterior probability or various fault identification rules; (5) model validation and verification may be conducted through various methods, such as sensitivity analysis, conflict analysis, simulation studies, and experimental studies. When diagnostic results are unsatisfactory, one or several of the first four steps are revised or replaced in the specific method used until satisfactory diagnostic results are obtained.
Fig. 1.2. Flowchart of BN-based fault diagnosis.
1.3.1.BN structure modeling
Several methods were reported in constructing BN structure models for fault diagnosis. Three main methods include cause-and-effect relationship, mapping algorithms, or structuring learning. Per cause-and-effect relationship method, one reflects on their knowledge and experience about faults and fault symptoms and then captures them into a BN. That is, network structure is established based on c...