![]()
PART I
THE DESIGN AND PLANNING OF HEALTHY CITIES
![]()
HEALTHY TRANSPORTATION
A Question of Mobility or Accessibility
ANDREW MONDSCHEIN
Introduction
Dreaming of Walking in New Delhi
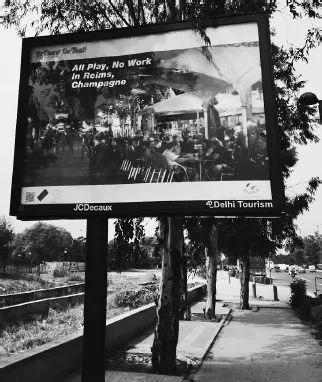
Billboards punctuate the verge of the Grand Trunk Road in New Delhi. Perched above an incomplete sidewalk along a highway choked with noxious traffic, wedged between a former landfill and the dying Yamuna River, signs advertise all kinds of needs and wants. One offering stands out in particular contrast with its surroundings, selling travel to Reims, France (see figure 1). The image depicts a pedestrian promenade lined with cafes, people sitting and socializing while others stroll casually in the middle of the road. The billboard image alongside the roadway mixes two urban extremes. In the France of the billboard, walking is safe and wholesome, physically beneficial and emotionally restorative. In the “real” Delhi, walking is poisonous and stressful, and being in a car at least filters the air and provides protection from noise and other vehicles.1
Certainly, the juxtaposition oversimplifies the complex environmental realities of both locales. Delhi’s inward-facing urban villages continue to facilitate walkability, and French cities are currently facing some of the worst air pollution in decades.2 Equity and access cloud the picture further, as who typically walks and drives in each locale varies significantly (see figure 2). The rest of the world’s streets likely lie somewhere between the Delhi and Reims exemplars. How do we balance among the sometimes contradictory solutions to our healthy mobility objectives, particularly when it comes to walking and biking, and what are those objectives anyway?
Rethinking Healthy Transportation Planning
In this essay, I review the state of research and practice in health-oriented transportation planning and design. The current approach to healthy transportation significantly emphasizes quantity of travel over the “qualitative” or experiential component of travel. Because of this emphasis, transportation planners, along with designers and engineers, are less able to effectively address key dimensions of the relationship between human health and everyday travel. To understand what may be missing, and what steps we can take to improve the situation, I examine the objectives of health-oriented transportation planning as they exist today. To a great degree, healthy transportation planning today is a matter of increasing quantities of nonmotorized trips—an emphasis on mobility. Even when the local built environment is taken into account, such as in the design of walkable communities, the primary objective remains increased walking and biking.
Figure 1. Billboards, like this one in New Delhi, India, demonstrate the desire of people to prefer environments where walking is easy. This billboard is advertising a vacation to Reims, France, where the streets are pedestrian friendly, which contradicts what pedestrians in this part of New Delhi face every day.
Then I explore how the experiential components of travel, not captured by standard transportation metrics, may also affect healthy travel. Some factors, such as collisions and environmental hazards, have been acknowledged for decades but have arguably not been successfully integrated into recent mobility planning trends. Other aspects of the travel experience, such as mental health and well-being, have only recently and tentatively come onto planners’ radar screens. Overall, I argue that as with travel as a whole, healthy transportation should prioritize access—to positive experiences and useful destinations—over undifferentiated nonmotorized mobility. Finally, the essay concludes with a discussion of how planners, as well as public health specialists, urban designers, and others, might take a more comprehensive and effectual approach to mobility and health, emphasizing three objectives for healthy mobility planning: (1) enhanced measurement of currently unmeasured human-environment variables, (2) better coordination of health with equity and social capital objectives, and (3) increased openness to a multiplicity of transportation–land use solutions that foster health.
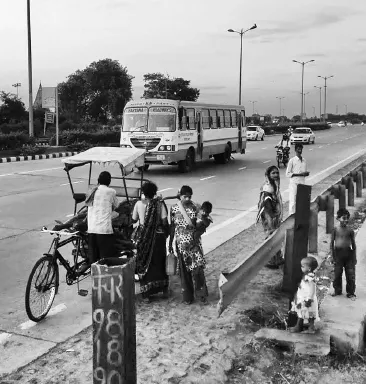
Figure 2. Crossing Grand Trunk Road in New Delhi, India, provides an example of the equity and access concerns of pedestrians.
Current Transportation Planning Practice
The Quantitative Metrics of Travel
As a systems-focused discipline, transportation planners primarily measure how much and how far. Regardless of travel mode—whether it be on foot, by bike, by transit, or in a private car—transportation planning is heavily driven by metrics of system usage and travel behavior. For decades, transportation planners have assiduously monitored the number and length of driving trips through surveys, observation, and modeling, and increasingly have done the same for transit, biking, and walking.3 Not surprisingly, then, transportation planning goals are almost always characterized in relation to these types of quantitative travel metrics. Environmentally sustainable travel is characterized as lower vehicle miles traveled (VMT), and a successful transit system may be characterized as increased ridership by both existing and “choice” riders.4 It follows that the typical way to characterize public health in transportation terms has been in terms of less driving and more walking and biking. One of the most cited papers in the Journal of the American Planning Association, “Travel and the Built Environment,” among many others, shows the centrality of this approach to analyzing and measuring the success of walking and biking interventions.5
Why is counting trips and trip lengths, by any mode, so important? Causing travel behavior change is central to transportation planning. Planners and allied disciplines seek to change people’s lifestyles and travel choices to encourage more active, nonmotorized travel and less driving.6 Most models of behavior change come down to increasing the relative utility of active travel over driving. As conceptualized within a behavioral economic framework, the dominant approaches seek to change travel behavior by changing an individual’s or household’s utilitarian decision making, raising the cost or inconvenience of driving or incentivizing walking and biking.7 These approaches understand travel as a “derived demand,” only useful inasmuch as it gets people to the activities and destinations at the end of the trip.8 While travel demand models take into account trip lengths or times, very little else about the trip itself is accounted for directly, though experiential factors that may have a direct impact on travel choices, such as wait times at bus stops and perceived safety, may be included as travel cost modifiers.9
Increased Active Travel, the Central Objective of Healthy Mobility
Within this derived-demand framework privileged in transportation planning, encouraging travel by one mode over another depends on making destinations relatively more accessible by one mode than another. So when activities, whether jobs, shopping, or otherwise, are easier to access on foot than by car, people will walk more and drive less, all else being equal. This access-based way of thinking about travel behavior is powerful and does a good job explaining the travel we actually observe in American cities.10 Encouraging more active travel for health, whether on foot or by bike, is conceptually the same. In fact, access to destinations has been found to be the most significant explanatory factor of increased utilitarian walking across numerous travel behavior studies. Walk Score, a web-based service that provides a 0 to 100 score for any location across the United States ranking that location’s “walkability,” as well as metrics for bikeability and transit-friendliness, bases its scores solely on the spatial proximity of a mix of destinations to each location.11 Walk Score’s metric, in turn, has been found to very strongly explain actual walking behavior in urban areas, similar to other metrics that emphasize the density or accessibility of destinations within a walkable area.12
Based on Walk Score and similar findings, planners have established a role for land use and urban design in healthy transportation. They argue that neighborhoods and cities that improve access to a range of destinations for walkers and bicyclists will facilitate the objective of increased active travel and reduced driving.13 Walkable, bikeable, and transit-oriented communities are all predicated on this basic behavioral principle, that these modes are more competitive with driving for accomplishing everyday activities when destinations are more mixed, densely packed, and linked by enhanced nonmotorized infrastructure. Importantly however, not all travel is destination-focused. Better access to destinations is associated with increased utilitarian walking, those everyday trips to work, errands, socializing, or other activities. However, recreational walking is more associated with access to nature and aesthetically appealing places.14 Regardless of whether walking or biking is for utilitarian or recreational purposes, however, the research has held to the idea that more is better than less.
Increasing nonmotorized travel with investments in infrastructure and walkable, bikeable urban form has a clear relationship to physical activity.15 Thus, the surge in obesity rates across the United States from the 1980s to the 2000s was and remains a major public health crisis, and insofar as physical activity is one component of a healthy BMI (body mass index), increased driving and overall sedentary lifestyles were identified as at least one possible cause of the obesity crisis.16 Ultimately, the linkage among the increases in automobility, reduced active travel, and obesity has been shown to be complex and tenuous in some cases.17 Americans started driving for most of their trips decades before the obesity crisis, and some of the most obese groups in the country, particularly poor and minority populations, also drive the least. The increase in unhealthy diets among populations worldwide, particularly low-income populations, is likely a more significant causal factor.18 Still, the hypothesized connection between reliance on cars and poor physical health outcomes in the early 2000s was galvanizing for transportation planners and public health officials across the country, as the prevalence of public health and active transportation studies suggests. In addition, even if trading driving for nonmotorized modes wasn’t the source of the epidemic, increased walking and biking continue to be understood as part of the treatment, not just for obesity and associated ailments, but mental health through exercise as well.
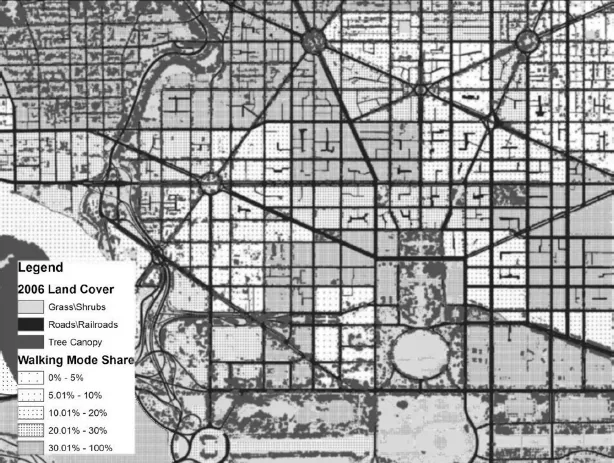
Figure 3. Map of central Washington, DC, with tree cover and walking rates overlapped to determine if higher tree cover leads to greater walking rates.
Measuring Trips: The Effect of Nature in DC
How does an emphasis on quantitative travel metrics skew healthy mobility research and practice? An analysis comparing walking rates to natural features in Washington, DC, shows the ease with which it may be possible to miss the forest for the trees, when considering health outcomes solely in terms of how much active travel. Figure 3 juxtaposes two datasets across central DC: green land cover and walking rates, as a percentage of travel by any mode.19 The satellite-based land cover data show that for a major city, DC is fairly well treed and parked, but significant variability exists across neighborhoods, from the National Mall and verdant Northwest DC to the dense business district in Downtown. Walking is also far more frequent in central DC than most American cities, with trips on foot accounting for more than 30 percent of all trips in some neighborhoods, shown using data from a 2008 regional travel survey. These two datasets, analyzed at the neighborhood scale, can illustrate the association, if any, between walking rates and presence of nature in terms of trees and green open space.
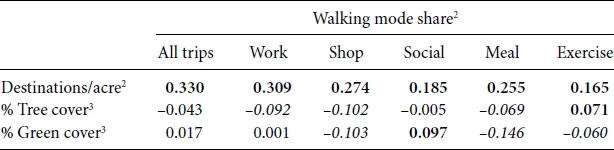
Table 1. Correlations between walking trip rates, destination density, and nature1
1. Correlations shown for 192 Washington, DC, transportation analysis zones in center of DC. Positive correlations over r=0.05 shown in bold, negative correlations below r=–0.05 shown in italics.
2. Source: Metropolitan Washington Council of Governments (2008).
3. Source: U.S. Department of Agriculture (2006).
Table 1 presents simple correlations between walking for different types of trips, utilitarian and recreational, and land use measures including destination density and green land cover, for the central portion of DC, comprising 192 transportation analysis zones (TAZs), which are substantially analogous to census tracts. The “destinations per acre” measure is derived from the Me...