The original CD-ROM accompanying the book and its content are no longer available.
eBook - ePub
Introduction to Quantitative Research Methods
An Investigative Approach
- 272 pages
- English
- ePUB (mobile friendly)
- Available on iOS & Android
eBook - ePub
About this book
Introduction to Quantitative Research Methods is a student-friendly introduction to quantitative research methods and basic statistics. It uses a detective theme throughout the text to show how quantitative methods have been used to solve real-life problems. The book focuses on principles and techniques that are appropriate to introductory level courses in media, psychology and sociology. Examples and illustrations are drawn from historical and contemporary research in the social sciences.
Trusted by 375,005 students
Access to over 1.5 million titles for a fair monthly price.
Study more efficiently using our study tools.
Information
Publisher
SAGE Publications LtdYear
2001Print ISBN
9780761968047
9780761968030
Edition
1eBook ISBN
9781446223284
1
Order at All Points
Counting and accounting
A man is driving through the bush one day and has to stop while a farmer takes his sheep across the road. There are quite a lot of sheep, so it takes a fair while. When they’ve all passed by, the man goes up to the farmer and asks, ‘If I can tell you how many sheep you have, to within one either way, can I have one of them?’ The farmer replies, ‘Course you can. You’ll never get it right.’ The man says, ‘You have six thousand four hundred and twenty two.’ ‘Well blow me down,’ replies the farmer – or words to that effect. ‘In fact I have six thousand four hundred and twenty one. I counted them this morning.’ So the man walks back to the car with his prize.
‘Wait on,’ cries the farmer. ‘If I can tell you what your job is, can I have her back?’ ‘Sure,’ says the man, ‘You’ll never guess.’ ‘Well,’ says the farmer, ‘I figure you’d be a statistician with the Australian Bureau of Statistics.’ ‘Well I’ll be …!’ the man replies, ‘Exactly right. How on earth did you know that?’
The farmer comes back: ‘Put me dog down and I’ll tell you.’
Traditional Australian Bush Yarn
THE Ql-Qt CONTINUUM1
Like many in the humanities and social sciences, I was trained to be (at the least) sceptical about statistical methods and (at most) downright hostile towards them. In sceptical mode, I was exhorted to use statistics not in the way a drunk uses a lamppost: for support rather than illumination. In hostile mode, the word was that statistics was for ‘positivists’ (a very unfair characterization, as it turns out, of positivism). What all of this well-meaning and humanistic advice ignored was the sheer fact that our social and cultural worlds, today, are massively subject to statistical accounts (see Hacking, 1982). Whenever we turn on the TV news or open a newspaper, the world is now routinely accounted for in terms of the numbers it generates: from world population statistics right down to chewing gum markets. In this respect, it’s not quite as if numbers were on one side of the coin and ‘lived cultures’ on the other. Rather, the technologies of numbering have become just one (though, in some disciplines, a dominant one) of the many practices that make up the cultures of modernity. In this brief introduction, then, I want to think through the supposed distinction (binary, even) between the quantitative (Qt) and the qualitative (Ql) and to show that the seal between the two is by no means as watertight as it is often assumed to be.
My first realization of an elision between Qt and Ql came to me when, out of sheer impecuniousness, I went to work for the Survey Research Centre at the Australian National University (ANU) in the mid-1970s. Prior to this way of supplementing my meagre PhD scholarship, my only encounter with statistics had been the compulsory undergraduate methods course in sociology, taught, as it happened, by a died-in-the-wool symbolic interactionist, a Ql-man if ever there was one! Said lecturer was, then, very happy for me to complete my statistics assignments by having a friend who was a physics student crunch the exercises on the university’s one mainframe computer by submitting bundles of punchcards. Not, then, exactly the best of trainings or qualifications, I admit. But working late at ANU, designing and administering the Australian Capital Territory (ACT) population surveys, I came to see what a symbolic and interactional process Qt work could be in practice. One of our clients at the time was the local Family Planning organization. It wanted to know which forms of contraception were most in use in the Capital Territory. The only problem with this was that the official sampling procedures required interviewers to jointly interview two members of each household selected (using lot numbers) on a rotational basis: oldest and third oldest in odd-numbered lots, and second oldest and fourth oldest in even-numbered lots. This meant, in effect, that a fair proportion of interviews involved parents and their older children – not exactly the best interactional setting to ask people about their contraceptive practices. The problem was both, and equally, statistical and ‘cultural.’ Qt and Ql could not be a simple binary. And, oh yes, the wonderful ‘solution’ we developed was to draw up a card with each kind of contraception numbered. Respondents were then shown the card and would say such things as ‘Well, I tried the number seven but it didn’t work for me, so now I prefer the twenty six.’
The same realization came back to me during a more recent research project (Mickler and McHoul, 1998). In this project, we collected over 600 newspaper articles on Aborigines, youth and crime over a 12-month period in the early 1990s in order to see whether there had been, as some suspected at the time, a media-generated ‘crime wave.’ We had a neutral reader/research-assistant type the articles into a relational database program (QSR NUD-IST) and, at the same time, code the articles for such things as ‘source’ (the origin of the reported events), ‘participants’ (the categories of persons reported on in each article) and how the reader thought the article was treating such ‘participants’ (in positive, negative or neutral moral terms). What we hoped to get out of this was a strongly Ql argument based on a discursive analysis of the news articles and their ‘readings.’ However, before long, we found that working with over 600 texts would not allow us to do this. The data in question were simply too numerous. And anyway, NUD · IST was starting to generate matrices of such things as ‘Date of publication’ × ‘Article source’ and ‘Newspaper’ × ‘Participants.’ Each cell of the matrix listed the relevant articles by their unique NUD · IST document number. There was no way we could work with this kind of output in a purely Ql mode. We had to show our findings graphically. This meant a lot of arduous work, transferring the totals of each cell into an Excel spreadsheet and then having Excel generate graphs and bar charts. (This was in NUD-IST version 3: the day we finished our gruelling transcription work, NUD-IST 4 was released, including new software that automatically converts such findings into popular spreadsheet and stats programs.) At that point we were able to generate ‘findings’ such as those in Chart 1.1.
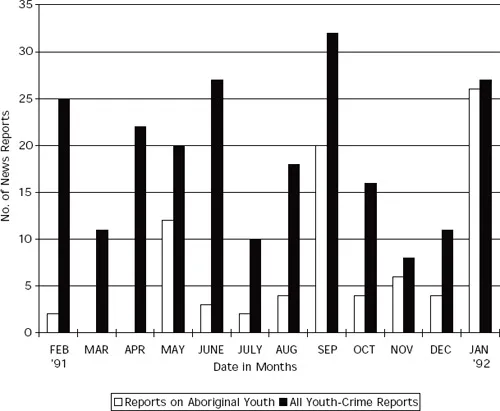
CHART 1.1 Reports on Aboriginal youth and all youth-crime reports, Feb. 1991 to Jon. 1992
This was very useful to us because it showed us a picture of the year’s news in terms of just when the WA press was reporting youth crimes, and the months during which young Aboriginal people were the ‘participants’ in those reports. However, while this could show us the media angle, it could not tell us whether or not the ‘peaks’ of youth crime reportage (and we were particularly interested in the September peak because it followed the infamous Rally for Justice outside Parliament House in the August) corresponded to ‘actual’ crime rates. If we were going to find a ‘media wave,’ we would have to overlay crime stats on to our bar chart. We eventually tracked these down at the University of Western Australia Crime Research Centre whose staff kindly gave us their raw figures for the 12-month period in question. Accordingly we could then generate more conclusive findings about the supposed ‘wave’ – see Chart 1.2.
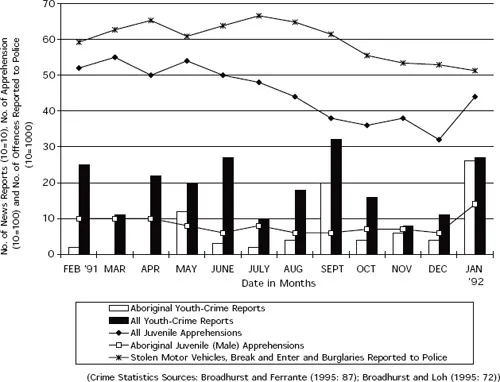
CHART 1.2 News reports on Aboriginal youth-crime and all youth-crime with actual crime data, Feb. 1991 to Jan. 1992
So we now had something like a ‘media wave.’ That is, as the reportage of youth crime peaked in September there was a corresponding decline in ‘actual’ crimes as measured by apprehensions and reports to the police.
Again, we could only see this graphically – though later we resorted to a more Ql discussion of how, in terms of routine media practices, the ‘wave’ could have been generated. That is, we wanted to show, from a close reading of the reports (in line with well-known facts about the news profession (Ericson et al., 1987, 1989, 1991)) that the statistically visible ‘wave’ was not so much a conscious conspiracy as a routine phenomenon in the field of ‘bad news as usual.’ As so frequently, the raw stats were open to more than one interpretation and only one of these was that the media were ‘deliberately’ causing the appearance of a crime wave with possibly suspect and populist motives.
Working on this project, then, brought me to the realization that there is in fact a continuum between hypothetically ‘pure’ Qt and Ql analysis. The two, that is, never actually exist, empirically, in their pure states. Qt work is part of the ‘culture’ at large and Ql work is never strictly free of numbers. So why then is there an effective stand-off between professionals in the two methodological fields? Why do some Qt workers insist on accepted sampling procedures and statistical reliability while some Ql workers argue that very small fragments of cultural ‘data’ (a poem, a few turns at talk, an advertisement, and so on) can generate just as fruitful findings? In order to begin to answer this question, we can turn to a rather extreme case of an anti-Qt argument. The one I have in mind was mounted some years ago by another major influence on my own methodological preferences: Harvey Sacks.
CULTURE AND THE RELIABILITY OF ‘DATA’2
Just as in physics, natural phenomena must be massively sampled before an argument about their properties can be mounted, so, in some branches of the social sciences, cases must be sufficiently large in number before generalizations can be acceptable to the professional community. The parallel is both noble and mistaken, according to several social theorists of (roughly) a phenomenological persuasion. Alfred Schütz, many years ago, and in works that are almost unknown to Qt types today, put this argument very simply (Schütz, 1962: 34–47). He noticed that natural scientists deal with objects of the first order of interpretation: that is, the objects that the natural scientist has before her have not been interpreted until she herself shows up on the scene. Atoms, planets and cyclones do not interpret themselves. However, as soon as we come to deal with human individuals or populations, we’re in a different situation entirely. These ‘objects of knowledge’ have interpreted themselves before the social scientist comes on the scene. They are therefore ‘objects’ of the second order of interpretation. They come pre-interpreted – and so the job of anyone working in the human sciences is to interpret the interpretations that people have already made of their lives (individually) and their cultures (collectively). Where human beings are concerned (as opposed to rats or atoms), the investigator is always investigating ‘second order’ matters. It is a fundamental category mistake, then, to treat humanly produced data as ‘natural’ data – though, as we will see shortly, this logical error need not preclude Qt analysis altogether: I am simply taking this argument as one of the most cogent to date on the underlying ‘philosophy’ of much Qt thinking.
Sacks’s important intervention into this debate – possibly via his association with Garfinkel (1967) who was, in turn, majorly influenced by Schütz – is to argue for a unique position for cultural ‘data.’ Not only, he ventures, is culture distinct from nature, it also has unique orderly properties. That is: in coming to analyse human cultures, one must take into account that they display ‘order at all points.’ The argument is complex and students would do best to consult the original (1995: 484). However, Schegloff (who introduces both volumes) puts the matter succinctly. Accordingly, I quote at length:
Considerations of enculturation and ‘language acquisition’ provide an especially provocative focus for a matter which Sacks raises … as a methodological point. Taking up the relevance of sampling, Sacks points out that it depends on the sort of order one takes it that the social world exhibits. An alternative to the possibility that order manifests itself at an aggregate level and is statistical in character is what he terms the ‘order at all points’ view…. This view, rather like the ‘holographic’ model of information distribution, understands order not to be present only at aggregate levels and therefore subject to an overall differential distribution, but to be present in detail on a case by case, environment by environment basis. A culture is not then to be found only by aggregating all of its venues; it is substantially present in each of its venues. (Schegloff in Sacks 1995: xlvi)
As with holographs, a culture must display its inherent order, no matter how much or little of it we happen to examine or ‘sample.’ (And, as we will see shortly, this importantly applies as much to the ‘much’ as it does to the ‘little.’) Even if 99 per cent of a holographic image is destroyed, the remaining 1 per cent contains all of the information contained in the original whole (Roe, 1998). In this respect, when we are dealing with social and cultural phenomena (such as ‘mental illness’ or ‘suicide,’ for example), the question of whether we have sufficient cases for the ‘data’ to be ‘reliable’ may not arise. The order we are seeking, as social scientists or cultural analysts, according to Sacks, is not available as a form of statistical aggregation; rather it must be inherently present in whatever materials happen to be at hand – for example just a few turns in a conversation. And, in fact, Sacks directly uses his ‘order at all points’ (or ‘in all venues’) model to criticize Qt research. His argument here is particularly directed at sociology and survey research, but it applies equally well to the other social sciences:
… you might find that the fact of ‘order at all points’ could be used to explain fairly strange facts; things like the following. For one, certain kinds of researches – for example, let’s say, taking very conventional sociology, survey research – would use the fact that it gets orderly results to indicate that it must be doing something decent. Now everybody knows – that is, everybody who has ever done such work, or studied it – that it’s almost universally extremely bad; that almost never can whatever the constraints are that ought to be used under their own formulation to decide that they have something, be used. There are, for example, all kinds of constraints on proper statistical...
Table of contents
- Cover Page
- Title
- Copyright
- Contents
- Tables
- Figures
- Acknowledgements
- Permissions
- 1 Order at all Points: Counting and accounting
- 2 Starting the Inquiry: ‘But what happened then?’
- 3 Defining the Inquiry: ‘Then how do you know?’
- 4 Methods of Inquiry: ‘It is a capital mistake to theorize before one has data!’
- 5 ‘Data! Data! Data!’: Analysing data from the inquiry
- 6 Finding Answers from the Inquiry: ‘Elementary, my dear Watson!’
- 7 Summarizing and Presenting Results: ‘Quite so!’
- Appendix I: Sample Letter for Informed Consent
- Appendix II: BSA Statement of Ethical Practice
- Appendix III: The Statistical Inquirer
- Index
Frequently asked questions
Yes, you can cancel anytime from the Subscription tab in your account settings on the Perlego website. Your subscription will stay active until the end of your current billing period. Learn how to cancel your subscription
No, books cannot be downloaded as external files, such as PDFs, for use outside of Perlego. However, you can download books within the Perlego app for offline reading on mobile or tablet. Learn how to download books offline
Perlego offers two plans: Essential and Complete
- Essential is ideal for learners and professionals who enjoy exploring a wide range of subjects. Access the Essential Library with 800,000+ trusted titles and best-sellers across business, personal growth, and the humanities. Includes unlimited reading time and Standard Read Aloud voice.
- Complete: Perfect for advanced learners and researchers needing full, unrestricted access. Unlock 1.5M+ books across hundreds of subjects, including academic and specialized titles. The Complete Plan also includes advanced features like Premium Read Aloud and Research Assistant.
We are an online textbook subscription service, where you can get access to an entire online library for less than the price of a single book per month. With over 1.5 million books across 990+ topics, we’ve got you covered! Learn about our mission
Look out for the read-aloud symbol on your next book to see if you can listen to it. The read-aloud tool reads text aloud for you, highlighting the text as it is being read. You can pause it, speed it up and slow it down. Learn more about Read Aloud
Yes! You can use the Perlego app on both iOS and Android devices to read anytime, anywhere — even offline. Perfect for commutes or when you’re on the go.
Please note we cannot support devices running on iOS 13 and Android 7 or earlier. Learn more about using the app
Please note we cannot support devices running on iOS 13 and Android 7 or earlier. Learn more about using the app
Yes, you can access Introduction to Quantitative Research Methods by Mark Balnaves,Peter Caputi in PDF and/or ePUB format, as well as other popular books in Social Sciences & Social Science Research & Methodology. We have over 1.5 million books available in our catalogue for you to explore.