![]()
1
GETTING STARTED WITH DATA AND SPSS
INTRODUCTION
When undertaking research studies, it is likely that data will have been collected. Much of this will be in a form suitable to be analysed statistically; that is, responses from a questionnaire or data collection sheet can be coded so that each response is represented by a number. When data have been coded, it can be entered to a data analysis program such as SPSS. SPSS is menu driven, making it easy to use.
This chapter will start by distinguishing between types of data. It will then move onto the situation of a pile of questionnaires that need to be coded before data are entered into SPSS. It will show the conventions for assigning codes to questionnaires before the data entry process. It will then go onto opening SPSS and giving a tour of features that will be explained during the course of this book. This will lead to how to set up a datasheet so that data can be entered into SPSS. The chapter then moves onto saving data and an introduction to SPSS syntax, which is mainly used as a means of recording the commands used for future analysis. Finally, actions associated with closing SPSS, encompassing saving, printing and exporting output are explained.
This chapter uses a questionnaire asking hotel employees about their knowledge of diabetes as well as the data collected from the resulting study.
THE AIMS OF THIS CHAPTER ARE:
- To distinguish between types of data.
- To learn how to code questionnaires/data collection sheets so the resulting data can be entered into SPSS.
- To show how to open SPSS.
- To guide the user round the windows and menus that comprise SPSS, so that data can be opened, entered and ultimately analysed.
- To explain how to save data, output angd command syntax.
PRELIMINARY TO THIS CHAPTER
This
is a radio button. SPSS uses them when it requires one option to be selected.
TYPES OF DATA
Paramount to all data entry and analysis is the knowledge of what type of data a given variable is because different types of data are coded and ultimately analysed in different ways. SPSS gives three options regarding types of data: nominal, ordinal and scale.
Nominal data
These are categorical data that have no order. The categories within each variable are mutually exclusive: respondents can only fall into one category. For example, respondents can only be one ethnicity from a given list. Where a nominal variable has two categories, it is often referred to as dichotomous or binary.
Examples of nominal variables:
Gender – respondents can be male or female
Disease/health status – respondents can either have a disease or not
Marital status – respondents can only have one marital status at a given time: single, married, separated, divorced, widowed
Ordinal data
These are also categorical variables in which the categories are ordered.
Examples of ordinal variables:
Age group – for example, 30–39, 40–49, 50–59, 60+
Likert scales – strongly agree, agree, neither agree nor disagree, disagree, strongly disagree
Scale data
In SPSS this covers discrete and continuous data. Discrete data comprise variables that can only take integers (whole numbers).
Examples of discrete data:
Number of nights spent in hospital
Number of courses of a given drug prescribed during the study period Age at last birthday
Number of cigarettes smoked in a week
Continuous data can (in theory at least) take any value. However, this is usually restricted by the accuracy of the equipment used for measuring. For example, scales for weighing adult human weights rarely measure more accurately than whole kilograms and occasionally to one decimal place. This is also for practical reasons; there is little need to weigh adult humans to greater precision than the nearest kilogram or 100 grams (1 decimal place).
Examples of continuous data:
Blood pressure
Body mass index (BMI)
Lung function, for example peak expiratory flow rate (PEFR)
CODING QUESTIONNAIRES
Once data collection is complete, then the next task is to decide how to code each question so that it can easily be seen which values should be inputted into SPSS. This is necessary because numerical values are needed representing answers to questions on a questionnaire or other data collection sheet for SPSS to analyse the data. The initial task of deciding on coding is best done using an unused questionnaire so that all possible codes can be written on the questionnaire without confusion. In addition, it is a good idea to write the variable names on this questionnaire. These steps help the coding process so that individual codes do not have to be remembered and also provides a permanent record of the coding of the dataset.
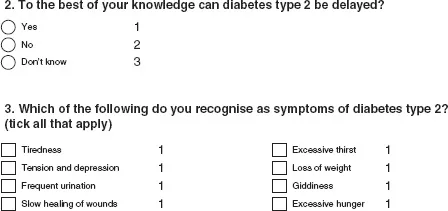
Figures 1.1a, 1.1b and 1.1c show excerpts from a questionnaire aimed at hotel employees to discover their knowledge of diabetes and to find out whether employees consider hotels (as a workplace) to be appropriate places to conduct health promotion specifically aimed at type 2 diabetes. These excerpts have not been annotated with possible variable names, but have been annotated with coding. Variable names should not be long (ideally eight characters), but should be as descriptive as possible (when setting up an SPSS datasheet it is possible to give each variable a longer label, this will be explained later in this chapter). Variable names must be unique within a dataset.
Questions 2 and 3 (Figure 1.1a) produced nominal data; there is no ordering. Question 2 lists three options and participants were asked to select one, therefore a different code is needed for all options. As the data are nominal the numbers given as the codes do not necessarily have to be 1, 2 and 3, they could have equally been 0, 1, and 2 or any other three unique numbers. The convention is to code nominal data using consecutive numbers, starting with 0 or 1.
FIGURE 1.1A EXCERPT FROM A QUESTIONNAIRE – QUESTIONS GIVING NOMINAL DATA
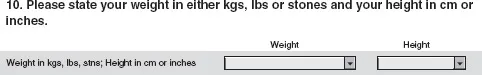
FIGURE 1.1B EXCERPT FROM A QUESTIONNAIRE – QUESTIONS GIVING CONTINUOUS DATA
Question 3 allows the participant to select as many options as they want. Therefore, each potential response needs to be coded and entered as a separate variable. Therefore, although it is presented on the questionnaire as one question, when the data are entered into SPSS for analysis, there will be eight variables. With Question 3, if the participant has not selected a given option, it is assumed that they do not recognise that option as a symptom of type 2 diabetes so these are eight yes and no questions. The simplest way to code these is to code as 1 where the option has been selected and 0 otherwise, gi...