![]()
The Test
Test 1 Z-test for a population mean (variance known)
Object
To investigate the significance of the difference between an assumed population mean
μ0 and a sample mean
Limitations
- It is necessary that the population variance σ2 is known. (If σ2 is not known, see the t-test for a population mean (Test 7).)
- The test is accurate if the population is normally distributed. If the population is not normal, the test will still give an approximate guide.
Method
From a population with assumed mean
μ0 and known variance
σ2, a random sample of size
n is taken and the sample mean
calculated. The test statistic
may be compared with the standard normal distribution using either a one- or two-tailed test, with critical region of size α.
Example
For a particular range of cosmetics a filling process is set to fill tubs of face powder with 4 gm on average and standard deviation 1 gm. A quality inspector takes a random sample of nine tubs and weighs the powder in each. The average weight of powder is 4.6 gm. What can be said about the filling process?
A two-tailed test is used if we are concerned about over- and under-filling.
In this Z = 1.8 and our acceptance range is –1.96 < Z < 1.96, so we do not reject the null hypothesis. That is, there is no reason to suggest, for this sample, that the filling process is not running on target.
On the other hand if we are only concerned about over-filling of the cosmetic then a one-tailed test is appropriate. The acceptance region is now Z < 1.645. Notice that we have fixed our probability, which determines our acceptance or rejection of the null hypothesis, at 0.05 (or 10 per cent) whether the test is one- or two-tailed. So now we reject the null hypothesis and can reasonably suspect that we are over-filling the tubs with cosmetic.
Quality control inspectors would normally take regular small samples to detect the departure of a process from its target, but the basis of this process is essentially that suggested above.
Numerical calculation
μ0 = 4.0,
n = 9,
= 4.6,
σ = 1.0
Z = 1.8
Critical value Z0.05 = 1.96 [Table 1].
H0: μ = μ0, H1: μ ≠ μ0 (Do not reject the null hypothesis H0.)
H0: μ = μ0, H1: μ = μ0 (Reject H0.)
Test 2 Z-test for two population means (variances known and equal)
Object
To investigate the significance of the difference between the means of two populations.
Limitations
- Both populations must have equal variances and this variance σ2 must be known. (If σ2 is not known, see the t-test for two population means (Test 8).)
- The test is accurate if the populations are normally distributed. If not normal, the test may be regarded as approximate.
Method
Consider two populations with means
μ1 and
μ2. Independent random samples of size
n1 and
n2 are taken which give sample means
and
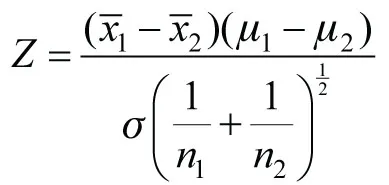
. The test statistic
may be compared with the standard normal distribution using either a one- or two-tailed test.
Example
Two teams of financial sales persons are compared to see if it is likely that the instruction each has received could have led to differing success rates. A sample of nine transactions (which involves the whole team) yields an average success rate of 1.2. Similarly a sample of 16 transactions for the second team yields a success rate of 1.7. The variances for both teams are equal to 2.0750 (standard deviation 1.4405). The success rate is calculated using a range of output measures for a transaction.
If we are only interested to know ...