From force field analysis to `zero defects?, from `brainstorming? to the Deming Wheel, this volume meets the need for a short, accessible reference to the 100 most frequently adopted methods for implementing total quality management.
Central to the book is a broad interpretation of TQM - the methods addressed are relevant to all those interested in using explicit tools, qualitative and quantitative, to assist problem-solving, analysis and evaluation in the management process. After an introduction briefly outlining the basic principles of TQM, the bulk of the book then provides clear, concise outlines of the 100 methods. It describes their purpose, application - `how to use? - and benefits, with examples. A classification of the methods is also provided, utilizing the broad schema?s of: management methods, idea generation, data collection and analysis.
Trusted by 375,005 students
Access to over 1.5 million titles for a fair monthly price.
To display discrete data collected by checksheets so that patterns can be discovered.
When to use
In the early stages of problem-solving when a team is trying to find out what is happening.
How to use
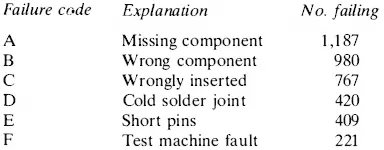
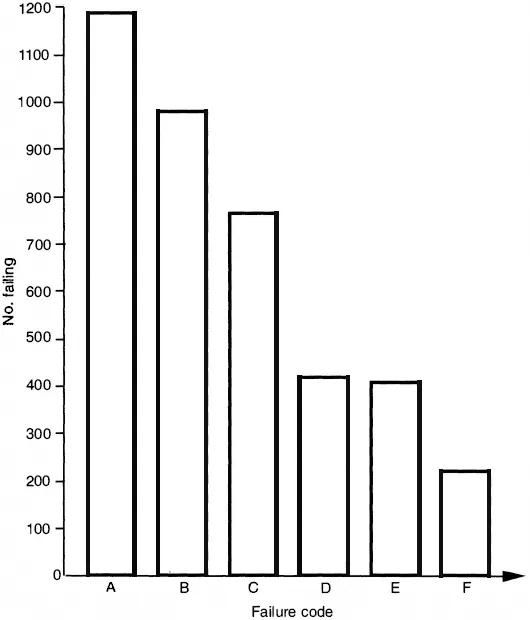
The number of times an event occurs is shown on the vertical axis. The value at which it occurs is shown on the horizontal axis. Figure 1 shows a bar chart of the reasons for in-test failure of a printed circuit board. Bar charts are sometimes used in conjunction with Pareto analysis (Method 20).
Benefits
Bar charts give a simple pictorial representation of data.
Example
The following data were used to produce the bar chart in Figure 1:
The bar chart shows clearly which reasons for failure need to be addressed to have any impact on the problem.
Figure 1 Bar chart of printed circuit board
Reference
H. Kume (1985) Statistical Methods for Quality Improvement. Tokyo: AOTS.
Method 69 Basic statistics
Purpose
The mean, median, mode, range and standard deviation are ways of summarizing and describing large volumes of data. The first three are measures of location; the last two are measures of spread.
When to use
When looking for patterns in data or when trying to compare large volumes of data, these parameters give statistically based measures that aid decision-taking.
How to use
The mean
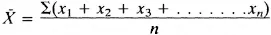
The mean is the simple arithmetic average of all the data points. To calculate the mean, add together all the points and divide by the number of points in the sum.
The mean is usually written
(pronounced X bar). The formula is
where there are n points called x1 to xn.
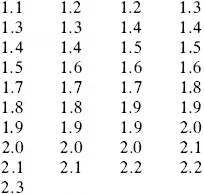
As an example, the following list gives the voltage derived from a circuit having variability due to poor tolerance control:
There are 37 points in total.
The sum ΣX is 1.1 + 1.2 + . . . + 2.3 = 63.3.
The mean voltage
= 63.3/37 = 1.71.
The median
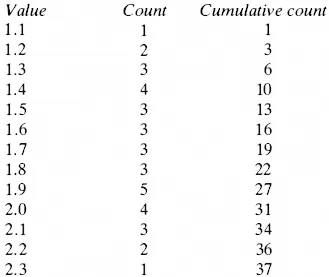
The median is the 50 per cent point, the point above which and below which half of the points lie. There is no formula for calculating the median. As an example, the above data are laid out in the form of a tally chart as follows:
The median will be the 19th point, somewhere between 1.7 and 1.8. It could be described as 1.7+ volts.
The mode
This is simply the most frequently occurring point. For example, in the data above, it is 1.9 volts. When the data are symmetrical about the mean, the mean, median and mode have the same value.
The range
The range is a measure of the overall spread of a set of values. It is defined as the arithmetic difference between the largest and smallest value. In the above example, the largest value is 2.3 and the smallest value is 1.1 so the range is 2.3 − 1.1 = 1.2 volts.
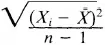
The standard deviation
The standard deviation is otherwise known as the root mean square deviation of all values from the mean. It is calculated by taking the difference of each value away from the mean, squaring it, and adding it to all the other squared deviations. The total is then divided by the number of values involved minus 1. The square root is then taken. This is written:
In the example ...
Table of contents
Cover Page
Title Page
Copyright Page
Contents
Preface
Understanding Total Quality Management
The Role of TQM Methods
List of Methods (by Category)
Purpose of Methods (Alphabetical List)
Management Methods
Analytical Methods
Idea Generation
Data Collection, Analysis and Display
References
Index
Frequently asked questions
Yes, you can cancel anytime from the Subscription tab in your account settings on the Perlego website. Your subscription will stay active until the end of your current billing period. Learn how to cancel your subscription
No, books cannot be downloaded as external files, such as PDFs, for use outside of Perlego. However, you can download books within the Perlego app for offline reading on mobile or tablet. Learn how to download books offline
Perlego offers two plans: Essential and Complete
Essential is ideal for learners and professionals who enjoy exploring a wide range of subjects. Access the Essential Library with 800,000+ trusted titles and best-sellers across business, personal growth, and the humanities. Includes unlimited reading time and Standard Read Aloud voice.
Complete: Perfect for advanced learners and researchers needing full, unrestricted access. Unlock 1.5M+ books across hundreds of subjects, including academic and specialized titles. The Complete Plan also includes advanced features like Premium Read Aloud and Research Assistant.
Both plans are available with monthly, semester, or annual billing cycles.
We are an online textbook subscription service, where you can get access to an entire online library for less than the price of a single book per month. With over 1.5 million books across 990+ topics, we’ve got you covered! Learn about our mission
Look out for the read-aloud symbol on your next book to see if you can listen to it. The read-aloud tool reads text aloud for you, highlighting the text as it is being read. You can pause it, speed it up and slow it down. Learn more about Read Aloud
Yes! You can use the Perlego app on both iOS and Android devices to read anytime, anywhere — even offline. Perfect for commutes or when you’re on the go. Please note we cannot support devices running on iOS 13 and Android 7 or earlier. Learn more about using the app
Yes, you can access 100 Methods for Total Quality Management by Gopal K Kanji,Mike Asher in PDF and/or ePUB format, as well as other popular books in Business & Management. We have over 1.5 million books available in our catalogue for you to explore.