![]()
1
Background
This book is intended for graduate students and postgraduate researchers in social and personality psychology who wish to build on a foundation of graduate-level training in analysis of variance and multiple regression analysis and familiarity with factor analysis to learn the basics of structural equation modeling.1 The book offers a nontechnical overview at a level of depth designed to prepare readers to read and evaluate reports of research, and begin planning their own research, using structural equation modeling. This concise, application-oriented treatment is no substitute for coursework and fuller written treatments such as can be found in textbooks (e.g., Bollen, 1989; Kaplan, 2009; Kline, 2010; Schumacker & Lomax, 2004). Rather, it provides a bridge between briefer treatments offered in book chapters and didactic journal articles (e.g., Hoyle, 2007; Weston & Gore, 2006) and those fuller treatments.
Structural equation modeling (SEM) is a term used to describe a growing and increasingly general set of statistical methods for modeling data. In light of the statistical training typical of researchers in social and personality psychology, two features of SEM are worth noting at the outset. First, unlike familiar statistical methods such as analysis of variance (ANOVA) and multiple regression analysis, which estimate parameters (e.g., means, regression coefficients) from individual cases, SEM estimates parameters from variances and covariances. Indeed, it is possible to apply most forms of SEM using only the variances of a set of variables and the covariances between them. Second, although this feature is not required and, on occasion, is not used, a significant strength of SEM is the capacity to model relations between latent variables; that is, the unobserved constructs of which observed variables are fallible representations. The focus on covariances rather than data from individual cases involves a move away from familiar estimators such as ordinary least squares toward more general estimators such as maximum likelihood. And the capacity to model relations between latent variables shifts the focus of data analysis from variables to constructs, thereby more closely aligning conceptual and statistical expressions of hypotheses. These departures from the statistical methods traditionally used by social and personality researchers require thinking differently about how data are brought to bear on research questions and hypotheses. The payoff is a comprehensive approach to modeling data that is well suited for empirical tests of the richly detailed, process-oriented models of the human experience typical of social and personality psychology.
In this opening chapter, I lay the groundwork for a nontechnical presentation of the nuts and bolts of SEM in the next three chapters and for promising applications in social and personality psychology in the final chapter. I begin by positioning SEM among the array of statistical methods of which most researchers in social and personality psychology would be aware. I then provide a sketch of the relatively short history of SEM. I next offer working definitions of key concepts with which many readers are not familiar. I conclude the chapter with a section on the use of path diagrams to convey a model to be estimated using SEM.
SEM in Statistical Context
One way to make clear the comprehensiveness of SEM and the flexibility it affords for modeling data is to compare it to the various statistical methods historically used in social and personality research. Before making these comparisons, it bears noting that the full set of techniques captured by the term “structural equation modeling” is ever expanding, so that the term now invokes a substantially broader set of techniques than when it came into standard usage in the late 1970s. Indeed, the continuing expansion of SEM capabilities has made the boundaries between SEM and other statistical approaches somewhat hard to define. With that caveat in mind, I can describe SEM in relation to traditional and emerging statistical methods.
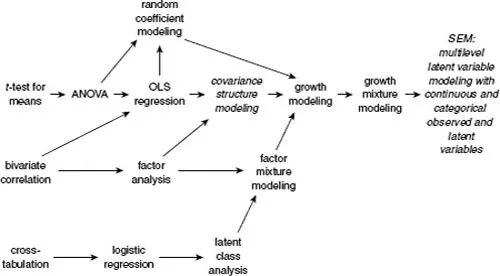
The names of statistical methods commonly used by researchers in social and personality psychology and selected newer methods are displayed in Figure 1.1. The methods are arrayed from specific to general moving from left to right. An arrow from one method to the next indicates that the former is a limited form of the latter. Put differently, methods to which arrows point could be used to address any statistical hypothesis that could be addressed by methods from which those arrows originate and any methods linked to them. For instance, referring to the top line in the figure, t-test is a limited form of ANOVA because it allows for a single factor with no more than two levels, whereas ANOVA accommodates multiple factors with two or more levels. ANOVA is the specific instance of ordinary least squares (OLS) regression in which all predictors are categorical. And so on.
We first encounter a form of SEM, covariance structure modeling, about midway across the figure. As evidenced by the arrows pointing to it, this elemental form of SEM incorporates the essential capabilities of multiple regression analysis and factor analysis. What is not apparent from the figure (and not essential information for the present discussion) is that covariance structure modeling is far more than simply a hybrid of these two well-known statistical strategies. Nevertheless, a useful starting point for researchers in social and personality psychology is the realization that, in simple terms, SEM can be conceptualized as an extension of multiple regression analysis in which multiple equations (often with multiple, directionally related outcomes) are simultaneously estimated and both predictors and outcomes can be modeled as the equivalent of factors as traditionally modeled in separate analyses using factor analysis.
Figure 1.1 Selected statistical methods in relation to structural equation modeling
A limitation of this form of SEM is the focus solely on covariances between variables that are assumed to be measured on continuous scales. Examination of other arrows leading to and away from the covariance structure modeling entry in the figure makes clear how SEM is expanded by incorporating means modeling and allowing for categorical variables. The addition of means to variances and covariances in the data matrix allows for the modeling of patterns of means over time in latent growth models (described in Chapter 5) as well as other models analyzed using random coefficient modeling. Analyses made possible by the ability to estimate parameters from categorical data are traced from specific to general along the bottom of Figure 1.1. The transition from logistic regression (and other forms of the generalized linear model) to latent class analysis represents a shift from categories manifest in the observed data to those that are unobserved and inferred from data. Traditional factor analysis and latent class analysis meet in factor mixture modeling, which allows for both continuous and categorical latent variables. The addition of means gives rise to growth mixture modeling, in which heterogeneity in trajectories of means is modeled as latent classes. The array culminates on the right in the long-winded but apt label, multilevel latent variable modeling with continuous and categorical observed and latent variables, which reflects the current breadth of models that can be estimated within the SEM framework.
A somewhat arbitrary, primarily semantic, but nonetheless instructive distinction that can be made between the methods shown in Figure 1.1 is between those used to analyze data and those used to model data (Rodgers, 2010). Of course, ANOVA, the prototypic analysis method, can be accurately described as a strategy for modeling sources of variance in individual data; however, ANOVA is typically used in such a way that a relatively standard model is virtually always applied (main effects and interactions). Custom contrasts, trend analyses and the like reflect a move from simply analyzing data from individual cases to modeling means. Factor analysis and latent class analysis reflect the transition from analyzing to modeling data. They suffer, however, from the limitation that, as typically used, models are discovered rather than posited and tested. From covariance structure modeling forward, the methods are best described as approaches to modeling data rather than simply analyzing data. This distinction is elaborated further in the next chapter.
A further distinction is between methods that typically are used to analyze or model individual cases and those typically used to model relations between variables. I noted at the outset that SEM differs from statistical methods commonly used by researchers in social and personality psychology in its focus on covariances rather than data from individual cases. To elaborate further, parameter estimation and statistical tests in familiar methods such as ANOVA and multiple regression analysis typically are based on the principle of minimizing the sum of the squared differences between observed scores for individual cases on the dependent variable and the case-level scores predicted by the independent variables. “Error” is defined as the average squared difference between observed and predicted scores across all cases. The goal of estimation in SEM is the minimization of the difference between the observed covariance matrix and the covariance matrix implied by the model. “Error” is defined as the difference between these two matrices as reflected in the value of an estimator-specific fitting function (covered in Chapter 3). In both cases the focus is on the degree to which a model either prescribed by the typical application of the method (as in ANOVA and multiple regression analysis) or specified by the researcher (as in SEM) reproduces the observed data. The distinction is in what constitutes the observed data – case-level scores in ANOVA and multiple regression analysis, variances, and covariances in SEM.
I close this section by noting a final pair of observations inspired by Figure 1.1. As established earlier, a statistical method can be used to accomplish any statistical hypothesis test that could be accomplished using methods prior to it in the figure. For instance, two means, which might typically be compared using the t-test, also could be compared using ANOVA, multiple regression analysis, and SEM. Although the use of SEM to compare two means could be defended on statistical grounds, practically speaking it would be unwise. The t-test is perfectly suited to this hypothesis test and requires little explanation or justification. Following this principle of using the simplest and most straightforward statistical method for hypothesis tests, SEM becomes relevant when the hypothesis is a model that implies multiple equations (i.e., statements of the relations between independent and dependent variables) and/or makes use of a data set that includes multiple indicators of key constructs, allowing for the expression of constructs as latent variables.
Although SEM is not always recommended for hypothesis testing in social and personality research, knowledge of the full array of modeling possibilities offered by SEM can inspire predictions and models that might not otherwise have been ventured. Research questions and explanatory models, on occasion, lead to the development of statistical methods for addressing them (e.g., models of intelligence and factor analysis). Typically, however, questions and models are shaped by the statistical methods of which the researcher is aware. As such, the more flexible and general the statistical approach, the broader the range of research questions and explanatory models likely to be ventured. The range of modeling possibilities afforded by SEM suggest new ways for social and personality psychologists to think about social and personality processes, pose research questions, design research, and analyze data.
Historical Roots
Most historical accounts of the development of SEM trace its origins to the early 1920s and the development of path analysis by Sewall Wright, an evolutionary biologist. Wright invented the statistical method of path analysis, a graphical model in which the linear relations between variables are expressed in terms of coefficients that are derived from the correlations between them (Wright, 1934). The potential value of Wright’s model for social research was not immediately recognized; it was not until the 1960s that applications of path analysis to social research data were more fully developed. The principal figures in early applications of path analysis to data from social research were sociologists Blalock (1964) and Duncan (1966). Duncan and Goldberger, an econometrician, integrated the sociological approach to path analysis with the simultaneous equations approach in economics (e.g., Goldberger & Duncan, 1973) and the factor analytic approach in psychology (e.g., Duncan, 1975; Goldberger, 1971), yielding the basic form of SEM.
This general model was formalized and extended in the 1970s by Jöreskog (1973), Keesling (1972), and Wiley (1973), producing what became known as the LISREL (Linear Structural RELations) model. This model includes two parts, one specifying the relations between indicators and latent variables – the measurement model – and the other specifying the relations between latent variables – the structural model. The LISREL model served as the basis for the LISREL software program, which, by the release of Version 3 in the mid-1970s, allowed substantively oriented social and behavioral researchers to specify, estimate, and test latent variable models using SEM.
The earliest uses of SEM in social and personality psychology appeared in the late 1970s and early 1980s. The earliest published applications in social psychology were by Peter Bentler and colleagues. For example, Bentler and Speckart (1979) used SEM to model the relation between attitude and behavior expressed as latent variables, including the first statistical modeling of the full set of relations in the influential theory of reasoned action (Fishbein & Ajzen, 1975). The earliest published uses of SEM in personality research are more difficult to pinpoint; however, by the mid-1980s applications of SEM, particularly the measurement model, to questions regarding personality structure began to appear (e.g., Reuman, Alwin, & Veroff, 1984; Tanaka & Bentler, 1983; Tanaka & Huba, 1984). In a prototypic application, Reuman et al. used SEM to model the achievement motive as a latent variable and show that, when random measurement error is separated from reliable common variance in fallible measures of the construct, validity coefficients are consistent with the theoretical model of the construct.
By the late 1980s, spurred by compelling applications such as those by Bentler and Speckart (1979) and Reuman et al. (1984), and better access to software for specifying and estimating models, SEM found traction in social and personality psychology. Its use, and particularly the interpretation of its results, quickly gave rise to a literature on misuses of SEM and misinterpretation of SEM results by psychological scientists (e.g., Baumrind, 1983; Breckler, 1990; Cliff, 1983). The use of SEM in social and personality psychology has improved and increased despite the fact that formal training in SEM in social and personality psychology doctoral programs is still not the norm (Aiken, West, & Millsap, 2008). Extracurricular workshops and didactic volumes such as this one are the means by which many researchers in social and personality psychology learn about the capabilities of SEM and acquire basic proficiency in its use (often as implemented in a specific statistical software package). Although SEM is not likely to join ANOVA and multiple regression analysis as statistical methods that all social and personality researchers must know, its use will no doubt increase as compelling applications are published with increasing frequency.
The Language of SEM
Terminology
As with any statistical method (though perhaps more so), SEM is characterized by terminology that takes on precise and specific meaning when used with reference to it. Key terms are given full treatment at appropriate points later in the book. Basic definitions, which are offered in this section, will allow me to use the terms selectively to provide an initial sketch of SEM in the remainder of this chapter and the first part of Chapter 2.
Perhaps the most basic term in the SEM lexicon is model, a formal statement about the statistical relations between variables. Models typically are conveyed in diagrams as shown later in this chapter, or as equations as shown in Chapter 2. The origin and evaluation of models in the SEM context vary according to the modeling approach taken (Jöreskog, 1993). In the strictly confirmatory approach, the goal is to evaluate the degree to which a single, a priori model accounts for a set of observed relations between variables. For example, a researcher might evaluate the degree to which self-ratings on a set of adjectives selected to represent four types of affect conform to a model i...