Challenging the often unquestioned notions of media objectivity, the author turns the classic questions: Who? What? When? and Why? onto the news media. By employing a range of theoretical perspectives and a large variety of examples, the author demonstrates the way in which our perceptions of the world are constructed by the news media.
- 256 pages
- English
- ePUB (mobile friendly)
- Available on iOS & Android
eBook - ePub
About this book
A lively and critical introduction to the news media, this book has been written specifically for media students and trainee journalists. Understanding Global News invites the reader to explore contemporary journalistic practice, and questions the assumption that the media provide a mere window on the world.
Trusted by 375,005 students
Access to over 1.5 million titles for a fair monthly price.
Study more efficiently using our study tools.
Information
Publisher
SAGE Publications LtdYear
1997Print ISBN
9780761957096
9780761957089
Edition
1eBook ISBN
9781446239971
1 | INTRODUCTION |
The only feeling that anyone can have about an event he does not experience is the feeling aroused by his mental image of the event...
For it is clear enough that under certain conditions men respond as powerfully to fictions as they do to realities, and that in many cases they help to create the very fictions to which they respond . . .
For certainly, at the level of social life, what is called the adjustment of man to his environment takes place through the medium of fictions. By fictions I do not mean lies. I mean a representation of the environment which is in lesser or greater degree made by man himself.
Walter Lippman, The world outside and the pictures in our heads’1
Is it easy to report the simple truth about plain reality? Or is what we see before our eyes largely determined by what we carry between our ears? Is the measure we take of things inevitably determined by the yardsticks we employ? Take something very basic such as maps: are such views of the world determined by world-views? If so, does this also extend to elementary language and categorizations, or even statistics and numbers? Do we inevitably frame places and people in ethnocentric ways? Is it possible to have news without views? Or do we judge the world ‘out there’ by the world ‘in here’, by mental representations continuously built and rebuilt through social processes?
Although a social scientist by training, I have spent large chunks of my life as a journalist, working for a wide range of daily and weekly newspapers, radio and TV broadcasters. My roles included those of foreign correspondent and roving reporter. I carried out assignments in some forty countries outside Western Europe and North America, in Africa, Asia and Latin America. Many things went right, but many things went wrong too. Today, most of my work is as a communication analyst and author. This is an appropriate time to make up the balance sheet and try to identify things I learnt the hard way: the many traps eagerly awaiting a Westerner bringing non-Western news. No matter what one does, one remains tied to one’s own perspective on the world, in many ways which are counter-intuitive, because everyday experience of the ordinary world seems so self-evident and unproblematic.
Let us begin with some very concrete examples. For one trimester each year, I teach seminars on media and intercultural communication within the international Access programme at the Faculty of Political, Social and Cultural Sciences of the University of Amsterdam. Occasionally, I also lecture on this subject at the Institute of Social Studies in The Hague, the Training Center of Radio Netherlands, and other places. Some students in these various English-language programmes may come from Holland itself, but the vast majority originates from other countries all over the world. In recent years, I have often started such courses with a little mind game, an exercise to demonstrate both the universality of ethnocentrism and its specificity.
Each student gets three blank pieces of paper and a thick, dark, felt-tipped pen. I start the stopwatch and give them three minutes (or five) – but no more – to draw a map of The Netherlands: their tiny host country at that point in time. After that, they have three more minutes to draw a map of Europe, and after that, three more minutes to draw a map of the world. It is an unfair game, of course. Three minutes are not nearly enough to gather your thoughts, recognize the traps, and produce a more or less correct map. The students are pushed to make flagrant mistakes and gross distortions.
The interesting fact is not so much that they make mistakes but which particular mistakes they make and how these mistakes vary with nationality and personal history. Dutch students render their own country in a very characteristic shape. They are never surprised to see that their maps match each other in great detail. They are surprised, however, to learn that their foreign colleagues do not have the faintest idea about even the approximate shape of their host country. Most render it as a simple blob, without any characteristic shape at all.
Similarly, the map of Europe posed few problems to most European students, but there were several snags. Students from the British Isles often had a less articulate view of ‘the Continent’. Non-Scandinavian students drew Norway, Sweden and Finland as three near-identical protrusions in the north. Northern students detailed those southern countries where they had been on a holiday. Even though most of these exercises took place after the fall of the Berlin wall and the Soviet Empire, all Western European students persisted in drawing ‘Europe’ as if it did not extend beyond Berlin, whereas Eastern European students usually made it three or four times as deep: up to and including the Ural Mountains. Students from Latin America accentuated the Iberian peninsula, and students from Catholic countries accentuated Italy (although they sometimes reversed the characteristic boot shape).
Most revealing, though, were the world maps: their idiosyncrasies as well as their similarities. As an illustration I reproduce and comment on half a dozen of these world maps here (Figure 1.1), as they were printed next to an article I wrote on the subject for a psychological magazine. A Palestinian map (upper left) has the major part of the world consisting of the continents of Eurasia and Africa, which seem to be entangled in a very confusing way. The Middle East is at the centre. The Gulf, the Saudi peninsula, the Red Sea and the delta of the Nile river are all very prominent. The Americas are quite marginal. The Japanese map (upper right) was drawn by someone who had studied in Great Britain before. It has Japan at the centre, but depicts the two island groups on either side of the Eurasian continent, which – by an interesting slip of the pen – is marked with the label ‘Europe’.
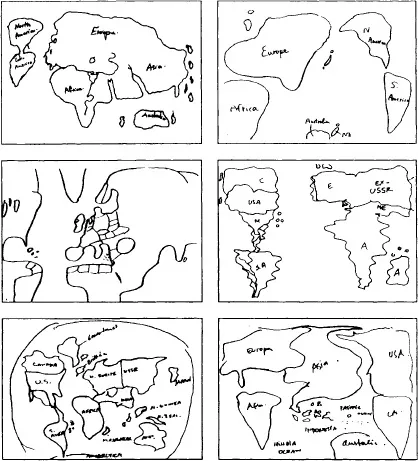
Figure 1.1 The mind game. World maps drawn by students from: Palestine (upper left), Japan (upper right), Holland (centre left), Brazil (centre right), the US (bottom left) and Indonesia (bottom right).
A Dutch map (centre left) has the Netherlands in the middle of the universe, and not nearly as small as it might seem to others. The Great Dike and the Zuiderzee/IJsselmeer inlet can easily be recognized. All other European countries are grouped around it. The Greek isles, Israel and its Arab neighbours are prominent. The former Dutch colony of Surinam (next to Guyana on the northern coast of South America), and the ‘Netherlands’ Antilles in the Caribbean, can easily be recognized as well. Half of the Americas, Africa and Asia have fallen off the map. By contrast a Brazilian map (centre right) makes the Americas much more prominent. The three North American countries are identified individually. The label for South America coincides with Brazil itself. The Spanish-speaking Andean countries look shaky in contrast, as does Africa. It seems to identify Portugal as the only individual country on the European continent; the E (and the form on which it is stamped) might identify either España or Europe. Italy is a small protrusion. The rest of the Eurasian continent is identified with the ‘ex-USSR’.
A US map makes the Anglo-Saxon world seem extremely prominent, from the US and Canada, via Britain, to Australia and New Zealand. Latin America has shrunk, and Latin Europe has disappeared. Those countries with which the US was at war ‘since the war’ have also become invisible, from Korea, China and Vietnam to Iran and Iraq. An Indonesian map in turn has the island archipelago in a rather central position, halfway between the ‘Hindia’ (Indian) Ocean and the Pacific Ocean. Asia dominates the map and Australia is also very large.
The mechanisms in all these cases are basically threefold. The first concerns centrality. There is a tendency to place one’s own country in a central position, at least, in a more central position than it would be in others’ maps, and to group the rest of the world around it. Simultaneously, there is a tendency to make other countries and, indeed, entire continents peripheral. To conceive of one’s own country as peripheral seems a very weird thought. The second mechanism concerns volume. There is a tendency to enlarge the surface of one’s own country, to inflate it disproportionately in comparison to others. Simultaneously, there is a tendency to deflate other areas considered as irrelevant. The third mechanism concerns articulation. There is a tendency to render one’s own country in great and characteristic detail, and to reduce other countries and continents to shapeless blobs. On the one hand, this is a very ‘logical’ result. On the other hand, it also betrays the collective narcissism with which we are all imbued.
But there is more. Apart from the idiosyncrasies of each nation, most of these maps from all around the world also had certain basic features in common. There was a general tendency to inflate the ‘developed’ countries of North America and Western Europe and to deflate the ‘developing’ countries of Asia, Africa and Latin America (except for the continent the student originated from). There was a general tendency to identify the former and present ‘great powers’, such as the (ex)-USSR and the USA. Great Britain and Ireland were often identified, as were Australia and New Zealand, and sometimes Canada. Students from former colonizing and formerly colonized countries often gave more weight to each other than to others.
Mental maps
The point is, of course, that all these are ‘mediated’ views of the world; they are not based on direct observation. Until the recent launching of manned spacecraft, no one had seen the world and the world map with his or her own eyes. Maps, for all their claims to physical exactness, are cultural productions. They map relevant places, distances, features of the land- and seascape. Mark Monmonier, author of Maps with the News and How to Lie with Maps, sums up:
Not only is it easy to lie with maps, it’s essential. To portray meaningful relationships for a complex, three-dimensional world on a flat sheet of paper or a video screen, a map must distort reality ... To avoid hiding critical information in a fog of detail, the map must offer a selective, incomplete view of reality. There’s no escape from the cartographic paradox: to present a useful and truthful picture, an accurate map must tell white lies.
The makers of maps often put their own city, country or reference points at the centre. Gradually, it dawned upon geographers and map-makers that the earth was not flat but round. In 1492 the first globe was produced, but the problem was how to render the surface of the global ball on paper. Peel an orange any way you want, and try to flatten its skin: you will always have to cut and force and damage it. The Mercator projection of 1569 was the best-known for centuries. It was originally a sea-farers’ map, but it distorted the land masses and it did so in a somewhat ethnocentric way, which basically stayed with us for centuries to come.
The world map with which we are most familiar today does two things. On the one hand, it enormously inflates the territories closer to the poles, that is to say, precisely those ‘northern’ continents and countries which came to dominate the modern world: the US with a huge Alaska, Canada and a huge Greenland, Western Europe and a huge Scandinavia, Russia in Eastern Europe and Asia with a huge Siberia. On the other hand, it enormously deflated territories closer to the equator: Latin America, Africa and Australia, for instance. Only recently have other projections tried to correct for this. A well-known alternative is the Peters projection, which keeps volume constant, by compensating for width with height and vice versa. This produces a world map which seems compressed in the north and elongated around the equator. More recently, Professor Robinson of the University of Wisconsin has worked out a compromise map for the authoritative US National Geographic Society. It retains some of the northern delusions of grandeur, but reduces them to a more realistic scale.
It has meanwhile been pointed out that apart from the pure volume of continents and countries, Western ethnocentrism also emerges in other features of the best-known world maps. The northern countries are at the top: they are implicitly depicted as superior to the southern countries on the map; some say they ‘dominate’ them. The most developed countries are usually depicted on the upper left side of the paper, which gives them a kind of primacy in those countries reading from top to bottom, and from left to right.
Most world maps also have the Atlantic at their centre, with North America in the upper left and Western Europe in the upper centre. Some world maps, however, have the Pacific at their centre with Western Europe in the upper left and Japan in the upper centre. Australians often proposed to reverse this entire pattern, and put Australia on top of the world. There is no need to add that there is no ‘natural’ order saying that one territory is at the top and another at the bottom, one territory to the left and another to the right. It is a completely arbitrary choice, made by and in the most developed countries to suit their view of the world. It came to be experienced as natural though, even to such an extent that space photographs of the earth are now usually depicted with the same conventions – which further seems to naturalize this world view.
The same holds for the geometric grid which was projected onto the earth’s surface to indicate an exact location by a combination of horizontal and vertical degrees. The numbering of the latitudes has a certain objective foundation, once we know that the earth has poles and turns around an axis. By contrast the meridian is a purely subjective invention, since there is no natural zero point. The British took the Greenwich (London) observatory as the centre of the universe and ultimately succeeded in having this view adopted worldwide. The French produced the standard metre (litre, kilogram) and ultimately succeeded in having their metric system adopted worldwide as well. Even describing the location of an event in such purely mathematical terms, therefore, literally means looking through a Eurocentric grid.
Even the hour of the day, and the well-known reference point of Greenwich Mean Time or GMT, implies a Eurocentric perspective, and in more subtle ways than we realize at first. Primacy is once again in Europe, in Great Britain, in London. Putting the date-line (date-change line) at the opposite end of the globe implies a dark midnight in the Pacific and a clear midday in the Atlantic. Saying something happened in the year so-and-so, furthermore, automatically introduces a very specific yardstick and cultural perspective. The arch-event, the reference point is made the birth of Jesus in the year zero of Western civilization: at the height of Roman civilization, halfway between the prelude of ancient Greek civilization and the follow-up of medieval Christian civilization.
This is not to say that this yardstick has not been ‘voluntarily’ adopted since by many others, that it is not convenient to share such a perspective with others, nor even to say that it matters very much – most of the time. But whereas we feel it is perfectly natural that other people can and do place themselves in our (‘universal’) time perspective, we do not feel it is equally natural for us to place ourselves in others’ (‘local’) time perspective – just every now and then. Nor are we aware that some Jews and Muslims live in an entirely different time perspective today (the latter make their time begin in 622 AD), as do many Hindus and Buddhists (the latter make their time begin in 544 BC), or that our year 1996 corresponded to 4694 in the Chinese lunar calendar (the Year of the Rat).
Thus ‘objective’ terminology about time and space hides subjective ideological connotations in many ways, as do many other seemingly objective categories employed universally. Let us take a closer look at just a few of the more basic terms used in everyday journalistic language.
Mental frames
Let us imagine a TV news item. It might say something like:
The Middle East conflict has claimed another Western victim. An American citizen was kidnapped outside the Peace Hotel in East Jerusalem on Saturday, December 24. The incident occurred at 9 p.m. (7 p.m. GMT). He was subdued by four masked men and driven away in a van. The victim is James Johnson (33), a black preacher from Trenton, New Jersey. He had come for a tour of the Holy Places with the church choir. Israeli authorities say responsibility has been claimed by the armed March 13 group. They have said they want to exchange the hostage for a fundamentalist cleric, who was arrested during a retaliatory raid against a terrorist base in Southern Lebanon last week.
This is a small and rather average news item. It provides an answer to the basic questions: who, what, where, when, why? But these answers might in turn generate a hundred other questions, some of which can easily be answered, but some of which cannot. Many things are implied, can be read between the lines, can be interpreted by whoever knows the right cultural codes. Why was this event reported? Would it also have been noticed if something similar had happened in the outskirts of an African capital, on another date, if the inferred motive had been criminal rather than political, or if the victim had a different nationality? East Jerusalem: is that not the part which used to belong to Jordan, and isn’t its Arab name Al Qudz? Saturday: is that not the Jewish Sabbath, right between the Islamic and the Christian holy days?
Many more questions can be imagined. Holy Places: which holy places? Church: what church? Why ‘authorities’ on the one hand, and ‘terrorist group’ on the other? We do know what ‘December 24’ refers to, but what does ‘March 13’ refer to? What happened at that time? Why is the capture of one person labelled ‘kidnapping’, and that of the other an ‘arrest’? Why is one action a ‘terrorist’ act, and the other a ‘retaliatory’ raid? Because we implicitly reject one act as illegitimate and accept the other as legitimate. Are there just Islamic ‘fundamentalists’, or are there also Jewish ‘fundamentalists’ and Christian ‘fundamentalists’? If fundamentalists are a multi-faith phenomenon, why are they labelled differently? What does this imply?
We will return to many of these mechanisms later, such as the ‘intuitive’ use of legitimating and delegitimating language by journalists in international news reporting. Here we will just limit ...
Table of contents
- Cover Page
- Title
- Copyright
- Contents
- Preface
- 1 Introduction
- 2 What is News, and What is ‘Nothing New’?
- 3 Which are the World’s Most Influential Media?
- 4 Who are Journalists and How Do They Work?
- 5 Who Gets to Speak in the World News?
- 6 When Does Something Become World News?
- 7 Where Does World News Come From?
- 8 How are Messages Formulated?
- 9 How do Images Come About?
- 10 What Effects do the Media Have?
- 11 Conclusion: Us, We and Them
- Appendix: Studying Global Media
- Bibliography
- Index
Frequently asked questions
Yes, you can cancel anytime from the Subscription tab in your account settings on the Perlego website. Your subscription will stay active until the end of your current billing period. Learn how to cancel your subscription
No, books cannot be downloaded as external files, such as PDFs, for use outside of Perlego. However, you can download books within the Perlego app for offline reading on mobile or tablet. Learn how to download books offline
Perlego offers two plans: Essential and Complete
- Essential is ideal for learners and professionals who enjoy exploring a wide range of subjects. Access the Essential Library with 800,000+ trusted titles and best-sellers across business, personal growth, and the humanities. Includes unlimited reading time and Standard Read Aloud voice.
- Complete: Perfect for advanced learners and researchers needing full, unrestricted access. Unlock 1.5M+ books across hundreds of subjects, including academic and specialized titles. The Complete Plan also includes advanced features like Premium Read Aloud and Research Assistant.
We are an online textbook subscription service, where you can get access to an entire online library for less than the price of a single book per month. With over 1.5 million books across 990+ topics, we’ve got you covered! Learn about our mission
Look out for the read-aloud symbol on your next book to see if you can listen to it. The read-aloud tool reads text aloud for you, highlighting the text as it is being read. You can pause it, speed it up and slow it down. Learn more about Read Aloud
Yes! You can use the Perlego app on both iOS and Android devices to read anytime, anywhere — even offline. Perfect for commutes or when you’re on the go.
Please note we cannot support devices running on iOS 13 and Android 7 or earlier. Learn more about using the app
Please note we cannot support devices running on iOS 13 and Android 7 or earlier. Learn more about using the app
Yes, you can access Understanding Global News by Jaap van Ginneken in PDF and/or ePUB format, as well as other popular books in Languages & Linguistics & Communication Studies. We have over 1.5 million books available in our catalogue for you to explore.