![]()
Chapter 1
Introduction
Today
there is no unifying description of the group of countries that make up the Middle East and North Africa (MENA). Historically, there were dozens of nomadic tribes occupying this area. If we look at the historical references in the Torah (Hebrew Bible), we can identify two distinct nomadic tribes in the area which remain to this day differentiated by language and religious customs. In the Torah, however, they are distinguished not by language or religion but rather by location and living style. The first group,
or Hebrew (Yibri)
1 refers to Abraham and his descendants as those who had traveled from the other side of the Euphrates River. The second group, the
2 or Arabs, are described as one of the nomadic tribes in the area who were “tent dwellers.”
The continuous animosity between these two major groups within MENA — the Hebrews (modern-day Israel) and the Arabs — is based on a long-standing division in economic and humanistic principles which sets them apart. Modern-day Israel is the only democracy in MENA with full access to the global economy and a dedication to investment in the human capital of its citizens. The Arab members of MENA are struggling with the concept of democracy, as was obvious from the discontent of the Arab Spring, and therefore are very cautious about the advantages of investing in the human capital of their citizens. These countries are still being governed by non-representative agents that rely on hate and xenophobia to control the lives of their populations.
3 Despite the long-standing animosity
between these two groups, and the acquiescence by the IMF, UN and World Bank to exclude Israel from MENA, this volume includes Israel as part of MENA. We do not, however, address the economic issue of the territories Israel captured or liberated in the 1967 war with Jordan. The question of who is a Palestinian — Hebrew or Arab — is relegated to the political arena, along with the legitimacy of the post WWI geographic division of the
into the current Arab states.
4A significant number of countries within MENA have historically avoided many of the necessary economic reforms that would take them out of the development trap. With the end of a century and a millennium many within MENA began a major period of stocktaking about their development experiences and started to discuss an agenda for the future. This developed a series of World Bank studies along with the first edition of this book. Overwhelmingly, sustained economic growth remained the fundamental answer for reducing poverty. Furthermore, the development record in Asia and Latin America confirmed the effectiveness of investing more — and more efficiently — in education and health, reducing barriers to trade and investment, dismantling domestic price controls in agriculture and industry and reducing fiscal deficits. The participation in a global production network and in a global research and development network, despite temporary dislocations, could not call into question the fundamental efficacy of “globalization.”
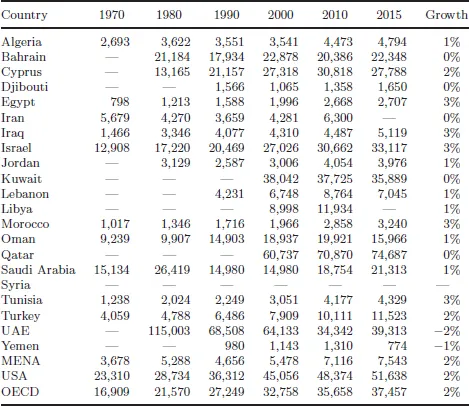
Economic development generally begins with a discussion of higher per capita income. In Table 1.1 we present a snapshot of the per capita GDP for the members of MENA, for 1970, 1980, 1990, 2000, 2010 and 2015. It is not surprising to find that for most of the MENA countries, there has not been a major uptick in real per capita income over this period. The exceptions include, Cyprus, Iraq, Israel, Morocco, Tunisia and Turkey. All of these countries undertook significant structural economic reforms along the lines of the “Washington Consensus,” which outlined a policy prescription for liberalizing markets.
The outcome of an effective economic development program involves much more than raising real per capita GDP. It involves a restructured educational system which can develop skilled workers for meaningful job opportunities. It involves an effective plan to provide full gender equality. It involves more efficient health and nutrition services. It involves a cleaner, more sustainable natural environment. It involves a transparent and impartial judicial and legal system. It involves civil and political freedoms without corruption.
As real per capita incomes rise, some of these other outcome variables are expected to improve. Within MENA, the old stakeholders have placed limits on these other outcome variables, which continue to have a devastating impact on political stability within their states and in the region in general. Without change in the qualitative dimensions of development, some of the current MENA leaders will find themselves overthrown by a popular grassroots apprising.
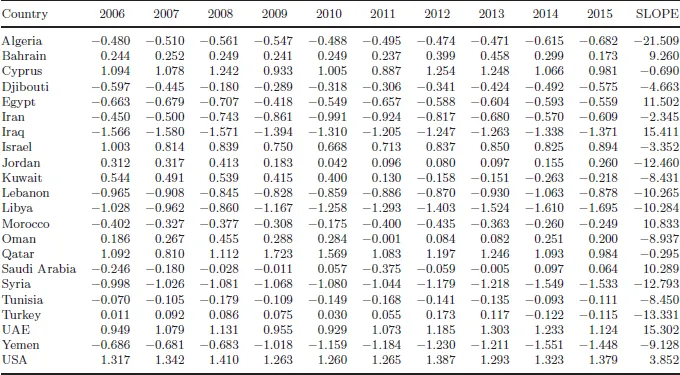
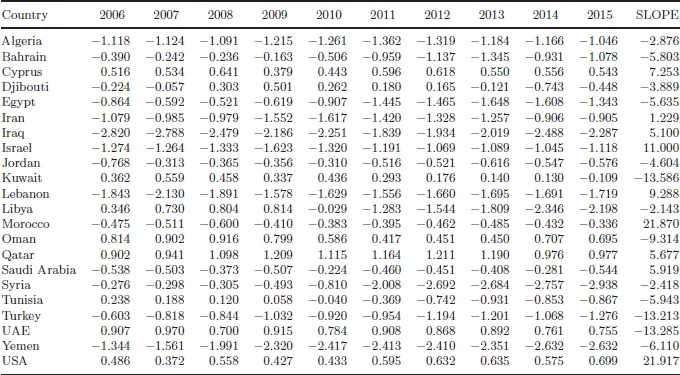
In order to address these other qualitative dimensions of economic development which can be used to characterize these MENA countries, we present the six summary variables developed by the Worldwide Governance Indicators project. (www.govindicators.org.). In Table 1.2 we present the aggregate indicators of Control of Corruption from 2006 to 2015 with a calculated slope to measures improvements or departures in the measure. Control of Corruption captures perceptions of the extent to which public power is exercised for private gain, including both petty and grand forms of corruption, as well as “capture” of the state by elites and private interests. The reported estimates provide the country’s score on the aggregate indicator, in units of a standard normal distribution, i.e., ranging from approximately –2.5 to 2.5. Positive measures equate with control of corruption. Several of the MENA countries exhibited positive improvements in controlling corruption as measured by the perception data. They included: Bahrain, Egypt, Iraq, Morocco, Saudi Arabia and the UAE. Having said that, most of the MENA countries experienced a loss of control of corruption throughout the 2006–2015 period.
Table 1.1.Per Capita GDP for Individual MENA Countries (1970–2015) (Constant 2010 US Dollars)
Source: World Bank — GDP per capita is gross domestic product divided by midyear population.
GDP is the sum of gross value added by all resident producers in the economy plus any product taxes and minus any subsidies not included in the value of the products. It is calculated without making deductions for depreciation of fabricated assets or for depletion and degradation of natural resources.
Data are in constant 2010 U.S. dollars.
Table 1.2.Control of Corruption
Source: Kaufmann et al. (2010).
Notes: Control of Corruption captures perceptions of the extent to which public power is exercised for private gain, including both petty and grand forms of corruption, as well as “capture” of the state by elites and private interests. Estimate gives the country’s score on the aggregate indicator, in units of a standard normal distribution, i.e., ranging from approximately –2.5 to 2.5.
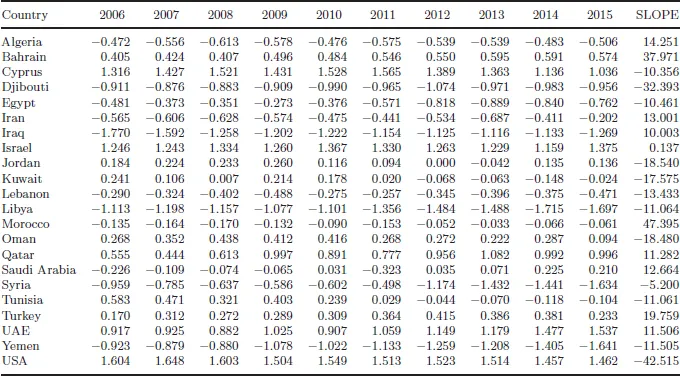
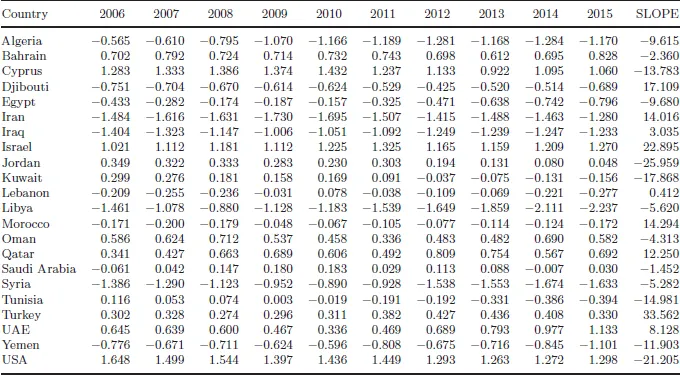
Table 1.3 presents the aggregate indicators for Government Effectiveness which captures perceptions of the quality of public services, the quality of the civil service and the degree of its independence from political pressures, the quality of policy formulation and implementation, and the credibility of the government’s commitment to such policies. The reported estimates provide the country’s score on the aggregate indicator, in units of a standard normal distribution, i.e., ranging from approximately –2.5 to 2.5. Several of the MENA countries exhibited positive improvements in government effectiveness as measured by the perception data. They included: Bahrain, Iraq, Israel, Morocco, Qatar, Saudi Arabia, Turkey and the UAE. Despite the improvements in government effectiveness for these MENA countries, the majority of MENA countries did not experience an effective government throughout the 2006–2015 period.
Table 1.4 presents the aggregate indicators for Political Stability and Absence of Violence/Terrorism measures perceptions of the likelihood of political and/or politically motivated violence, including terrorism. The reported estimates provide the country’s score on the aggregate indicator, in units of a standard normal distribution, i.e., ranging from approximately –2.5 to 2.5. Unfortunately, the historic perception of political stability for most countries within MENA is very pessimistic. While there were some minor improvements in perception concerning violence and terrorism, all the observations were in the unstable range. Observations for Morocco and Israel showed the greatest level of optimism.
Table 1.5 presents the aggregate indicators for Regulatory Quality which captures perceptions of the ability of the government to formulate and implement sound policies and regulations that permit and promote private sector development. The reported estimates provide the country’s score on the aggregate indicator, in units of a standard normal distribution, i.e., ranging from approximately –2.5 to 2.5. The historic perception of regulatory quality in favor the development of a private sector various across the spectrum for most countries within MENA. On the optimistic side stands Israel, Qatar, Turkey and the UAE, where there have been major efforts to bring back the market economy with limited State intervention. In the balance of MENA countries, the role and importance of the State still dominates economic activity for most of the population.
Table 1.6 presents the aggregate indicators for Rule of Law which captures perceptions of the extent to which agents have confidence in and abide by the rules of society, and in particular the quality of contract enforcement, property rights, the police, and the courts, as well as the likelihood of crime and violence. The reported estimates provide the country’s score on the aggregate indicator, in units of a standard normal distribution, i.e., ranging from approximately –2.5 to 2.5. The perception for a positive set of norms called Rule of Law exists in Bahrain, Cyprus, Israel, Jordan, Oman, Qatar, Saudi Arabia, and the UAE. The biggest improvements for the perception of Rule of Law were for Israel, Qatar, Saudi Arabia and the UAE. For the balance of countries within MENA, the perception of a positive expectation for Rule of Law was non-existent and sadly deteriorating.
Table 1.3.Government Effectiveness
Source: Kaufmann et al. (2010).
Notes: Government Effectiveness captures perceptions of the quality of public services, the quality of the civil service and the degree of its independence from political pressures, the quality of policy formulation and implementation, and the credibility of the government’s commitment to such policies. Estimate gives the country’s score on the aggregate indicator, in units of a standard normal distribution, i.e., ranging from approximately –2.5 to 2.5.
Table 1.4.Political Stability and Absence of Violence/Terrorism
Source: Kaufmann et al. (2010).
Notes: Political Stability and Absence of Violence/Terrorism measures perceptions of the likelihood of political and/or politically motivated violence, including terrorism.
Estimate gives the country’s score on the aggregate indicator, in units of a standard normal distribution, i.e., ranging from approximately −2.5 to 2.5.
Table 1.5.Regulatory Quality
Source: Kaufmann et al. (2010).
Notes: Regulatory Quality captures perceptions of the ability of the government to formulate and implement sound policies and regulations that permit and promote private sector development.
Estimate gives the country’s score on the aggregate indicator, in u...