
Microsoft Power BI Complete Reference
Bring your data to life with the powerful features of Microsoft Power BI
Devin Knight, Brian Knight, Mitchell Pearson, Manuel Quintana, Brett Powell
- 794 pages
- English
- ePUB (mobile friendly)
- Available on iOS & Android
Microsoft Power BI Complete Reference
Bring your data to life with the powerful features of Microsoft Power BI
Devin Knight, Brian Knight, Mitchell Pearson, Manuel Quintana, Brett Powell
About This Book
Design, develop, and master efficient Power BI solutions for impactful business insights
Key Features
- Get to grips with the fundamentals of Microsoft Power BI
- Combine data from multiple sources, create visuals, and publish reports across platforms
- Understand Power BI concepts with real-world use cases
Book Description
Microsoft Power BI Complete Reference Guide gets you started with business intelligence by showing you how to install the Power BI toolset, design effective data models, and build basic dashboards and visualizations that make your data come to life.
In this Learning Path, you will learn to create powerful interactive reports by visualizing your data and learn visualization styles, tips and tricks to bring your data to life. You will be able to administer your organization's Power BI environment to create and share dashboards. You will also be able to streamline deployment by implementing security and regular data refreshes.
Next, you will delve deeper into the nuances of Power BI and handling projects. You will get acquainted with planning a Power BI project, development, and distribution of content, and deployment. You will learn to connect and extract data from various sources to create robust datasets, reports, and dashboards. Additionally, you will learn how to format reports and apply custom visuals, animation and analytics to further refine your data.
By the end of this Learning Path, you will learn to implement the various Power BI tools such as on-premises gateway together along with staging and securely distributing content via apps.
This Learning Path includes content from the following Packt products:
- Microsoft Power BI Quick Start Guide by Devin Knight et al.
- Mastering Microsoft Power BI by Brett Powell
What you will learn
- Connect to data sources using both import and DirectQuery options
- Leverage built-in and custom visuals to design effective reports
- Administer a Power BI cloud tenant for your organization
- Deploy your Power BI Desktop files into the Power BI Report Server
- Build efficient data retrieval and transformation processes
Who this book is for
Microsoft Power BI Complete Reference Guide is for those who want to learn and use the Power BI features to extract maximum information and make intelligent decisions that boost their business. If you have a basic understanding of BI concepts and want to learn how to apply them using Microsoft Power BI, then Learning Path is for you. It consists of real-world examples on Power BI and goes deep into the technical issues, covers additional protocols, and much more.
Frequently asked questions
Information
Creating and Formatting Power BI Reports
- Report planning
- Live connections to Power BI datasets
- Visualization best practices
- Choosing the visual
- Visual interactions
- Slicers
- What-if parameters
- Report filter scopes
- Relative date filtering
- Conditional formatting
- Mobile-optimized reports
Report planning
- Identify the users or consumers of this report:
- Senior managers generally prefer less self-service interactivity and value simple, intuitive visuals, such as KPIs.
- Analysts often require significant flexibility to filter and interact with more detailed reports. For example, reports used by analysts generally include more slicer visuals and may include table or matrix visuals as well.
- Define the business question(s) that the report should answer or support:
- Confirm with the business user(s) or project sponsors that this is the appropriate focus and scope of the report:
- A report architecture diagram described in the next section can support this communication.
- For example, the user could be advised that a particular business question or metric will be included in a different report but will be featured on the same dashboard and will be easily accessible within the same Power BI app.
- The most important business question (for example, What were our sales?) will be addressed in the top-left corner of the report canvas, likely with a KPI or card visual.
- Confirm with the business user(s) or project sponsors that this is the appropriate focus and scope of the report:
- Confirm that the dataset supports the business questions:
- The report author should ensure that the dataset includes measures such as year-over-year (YOY) sales and the dimension columns (for example, Product Category) necessary to visualize the business questions.
-
- If a gap exists between the dataset and the measures required for the report, the team can determine whether the dataset should be extended or whether the measure should be created local to the report
- Only measures can be created within Power BI Live connection reports
- Any new columns, tables, or modifications to existing tables or columns must be implemented within the source dataset
- Determine how the report will be accessed and the nature of any user interactivity:
- Reports and dashboards can be optimized for mobile device consumption if this use case is expected
- Power BI Desktop supports slicer visuals, a What-if parameter, and visual interaction options as standard features:
- Reports can, therefore, be designed for static consumption or to support rich data exploration
- Draw a sketch of the report layout:
- At least for the primary page of the report, document how the area of the report canvas will be allocated
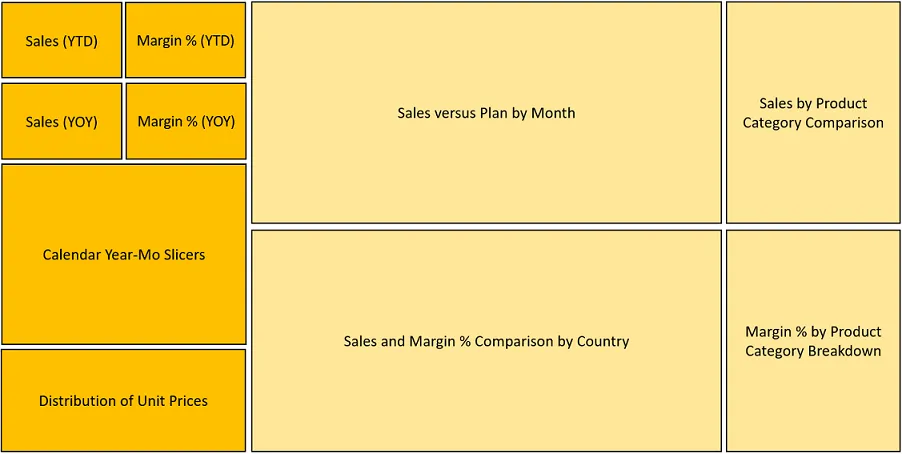
-
- Per the sample layout, the critical sales and margin measures are located in the top-left corner of the report page:
-
- Slicer (filter) visuals are planned for below these KPI or card visuals and other visuals will add further context
- Greater space is allocated to the two visuals in the middle of the page given their importance to the report
- The report layout sketch can be used exclusively for planning purposes or can be set as the background for a report page
- For example, a PowerPoint slide of the same shapes, background shading, and borders can be saved to a network directory as a PNG file
- In Power BI Desktop, the PNG file can be imported via the Add Image formatting option under Page Background or via the insert an image icon on the Home tab in Report view
- Page background images with proper alignment, spacing, and colors can expedite quality report development