Kibana 7 Quick Start Guide
eBook - ePub

Kibana 7 Quick Start Guide

Visualize your Elasticsearch data with ease

  1. 172 pages
  2. English
  3. ePUB (mobile friendly)
  4. Available on iOS & Android
eBook - ePub

Kibana 7 Quick Start Guide

Visualize your Elasticsearch data with ease

About this book

A quick start guide to visualize your Elasticsearch data

Key Features

  • Your hands-on guide to visualizing the Elasticsearch data as well as navigating the Elastic stack
  • Work with different Kibana plugins and create effective machine learning jobs using Kibana
  • Build effective dashboards and reports without any hassle

Book Description

The Elastic Stack is growing rapidly and, day by day, additional tools are being added to make it more effective. This book endeavors to explain all the important aspects of Kibana, which is essential for utilizing its full potential.

This book covers the core concepts of Kibana, with chapters set out in a coherent manner so that readers can advance their learning in a step-by-step manner. The focus is on a practical approach, thereby enabling the reader to apply those examples in real time for a better understanding of the concepts and to provide them with the correct skills in relation to the tool. With its succinct explanations, it is quite easy for a reader to use this book as a reference guide for learning basic to advanced implementations of Kibana. The practical examples, such as the creation of Kibana dashboards from CSV data, application RDBMS data, system metrics data, log file data, APM agents, and search results, can provide readers with a number of different drop-off points from where they can fetch any type of data into Kibana for the purpose of analysis or dashboarding.

What you will learn

  • Explore how Logstash is configured to fetch CSV data
  • Understand how to create index patterns in Kibana
  • Become familiar with how to apply filters on data
  • Discover how to create ML jobs
  • Explore how to analyze APM data from APM agents
  • Get to grips with how to save, share, inspect, and edit visualizations
  • Understand how to find an anomaly in data

Who this book is for

Kibana 7 Quick Start Guide is for developers new to Kibana who want to learn the fundamentals of using the tool for visualization, as well as existing Elastic developers.

Frequently asked questions

Yes, you can cancel anytime from the Subscription tab in your account settings on the Perlego website. Your subscription will stay active until the end of your current billing period. Learn how to cancel your subscription.
No, books cannot be downloaded as external files, such as PDFs, for use outside of Perlego. However, you can download books within the Perlego app for offline reading on mobile or tablet. Learn more here.
Perlego offers two plans: Essential and Complete
  • Essential is ideal for learners and professionals who enjoy exploring a wide range of subjects. Access the Essential Library with 800,000+ trusted titles and best-sellers across business, personal growth, and the humanities. Includes unlimited reading time and Standard Read Aloud voice.
  • Complete: Perfect for advanced learners and researchers needing full, unrestricted access. Unlock 1.4M+ books across hundreds of subjects, including academic and specialized titles. The Complete Plan also includes advanced features like Premium Read Aloud and Research Assistant.
Both plans are available with monthly, semester, or annual billing cycles.
We are an online textbook subscription service, where you can get access to an entire online library for less than the price of a single book per month. With over 1 million books across 1000+ topics, we’ve got you covered! Learn more here.
Look out for the read-aloud symbol on your next book to see if you can listen to it. The read-aloud tool reads text aloud for you, highlighting the text as it is being read. You can pause it, speed it up and slow it down. Learn more here.
Yes! You can use the Perlego app on both iOS or Android devices to read anytime, anywhere — even offline. Perfect for commutes or when you’re on the go.
Please note we cannot support devices running on iOS 13 and Android 7 or earlier. Learn more about using the app.
Yes, you can access Kibana 7 Quick Start Guide by Anurag Srivastava in PDF and/or ePUB format, as well as other popular books in Computer Science & Data Modelling & Design. We have over one million books available in our catalogue for you to explore.

Information

Introducing Kibana

Kibana is a dashboard tool that's easy to use and works closely with Elasticsearch. We can use Kibana for different use cases, such as system monitoring and application monitoring. Kibana isn't just a visualization tool, it also creates a complete monitoring ecosystem when we leverage the power of Elastic Stack. Here's a small example: you're working on a project where you can't tolerate any outrage, be it due to the database, application, system-related issues, or anything related to the application's performance. In a traditional monitoring system, you can monitor system performance, application logs, and so on. But with Kibana and Elastic Stack, we can do following:
  • Configure Beats to monitor system metrics, database metrics, and log metrics
  • Configure APM to monitor your application metrics and issues if your application platform is supported
  • Configure the JDBC plugin of Logstash to pull RDBMS data into Elasticsearch to make it available to Kibana for creating visualizations on KPIs
  • There are different third-party plugins that help us to get data from those sources, for example, you can use the Twitter plugin to get Twitter feeds
  • You can create alerts for certain thresholds, so that whenever that situation occurs, you get alerts so you don't have to continuously monitor the application
  • You can apply machine learning on your data to get data anomalies or future trends by analyzing the current dataset
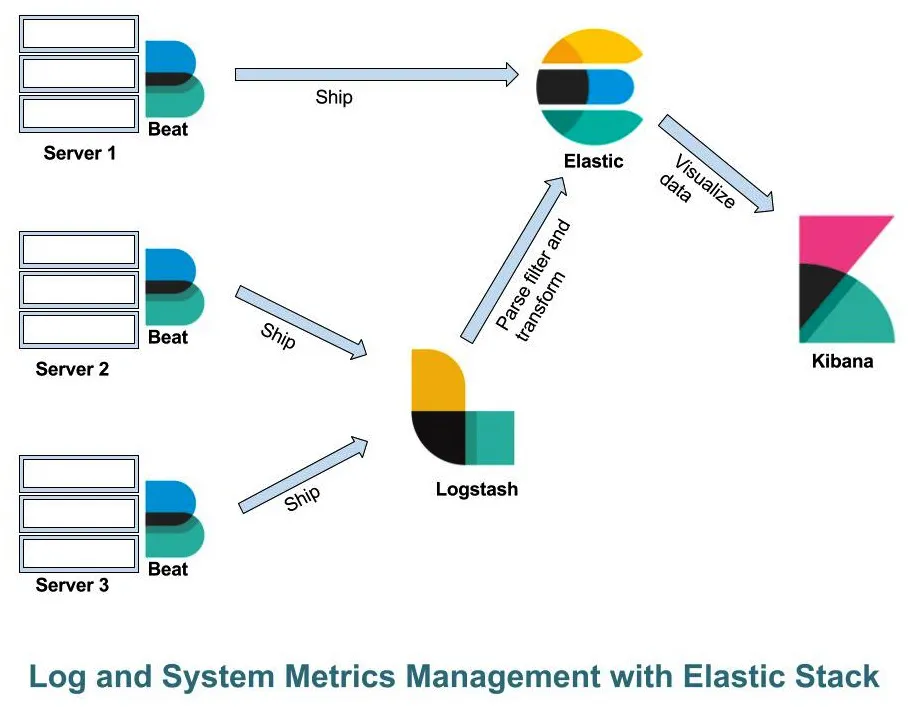
Elastic Stack

Kibana with Elastic Stack can be used to fetch data from different sources and filter, process, and analyze it to create meaningful dashboards. Elastic Stack has the following components:
  • Elasticsearch: We can store data in Elasticsearch.
  • Logstash: A data pipeline that we can use to read data from various sources, and can write it to various sources. It also provides a feature to filter the input data before sending it to output.
  • Kibana: A graphical user interface that we can use to do a lot of things, which I will cover in this chapter.
  • Beats: Lightweight data shippers that sit on different servers and send data to Elasticsearch directly or via Logstash:
    • Filebeat
    • Metricbeat
    • Packetbeat
    • Auditbeat
    • Winlogbeat
    • Heartbeat
The following diagram shows how Elastic Stack works:
In the preceding diagram, we have three different servers on which we have installed and configured Beats. These Beats are shipping data to Elasticsearch directly or via Logstash. Once this data is pushed into Elasticsearch, we can analyze, visualize, and monitor the data in Kibana. Let's discuss these components in detail; we're going to start with Elasticsearch.

Elasticsearch

Elasticsearch is a full-text search engine that's primarily used for searching. It can also be used as a NoSQL database and analytics engine. Elasticsearch is basically schema-less and works in near-real-time. It has a RESTful interface, which helps us to interact with it easily from multiple interfaces. Elasticsearch supports different ways of importing various types of structured or unstructured data; it handles all types of data because of its schema-less behavior, and it's quite easy to scale. We have different clients available in Elasticsearch for the following languages:
  • Java
  • PHP
  • Perl
  • Python
  • .NET
  • Ruby
  • JavaScript
  • Groovy
Its query API is quite robust and we can execute different types of queries, such as boosting some fields over other fields, writing fuzzy queries, or searching on single or multiple fields, along with field search. Applying a Boolean search or wildcard search aggregation is another important feature of Elasticsearch, which helps us to aggregate different types of data; it has multiple types of aggregations, such as metric aggregation, bucket aggregation, and term aggregation.

In fuzzy queries, we match words even then if there's no exact match for the spelling. For example, if we try to search a word with the wrong spelling, we can get the correct result using fuzzy search.
The architecture of Elasticsearch has the following components:
  • Cluster: A collection of one or more nodes that work together is known as a cluster. By default, the cluster name is elasticsearch, which we can change to any unique name.
  • Node: A node represents a single Elasticsearch server, which is identified by a universally unique identifier (UUID).
  • Index: A collection of documents where each document in the collection has a common attribute.
  • Type: A logical partition of the index to store more than one type of document. Type was supported in previous versions and is deprecated from 6.0.0 onward.
  • Document: A single record in Elasticsearch is known as a document.
  • Shard: We can subdivide the Elasticsearch index into multiple pieces, which are called shards. During indexing, we can provide the number of shards required.
Elasticsearch is primarily used to store and search data in the Elastic Stack; Kibana picks this data from Elasticsearch and uses it to analyzes or visualizes it in the form of charts and more, which can be combined to create dashboards.

Logstash

Logstash is a data pipeline that can take data input from various sources, filter it, and output it to various sources; these sources can be files, Kafka, or databases. Logstash is a very important tool in Elastic Stack as it's primarily used to pull data from various sources and push it to Elasticsearch; from there, Kibana can use that data for analysis or visualization. We can take any type of data using Logstash, such as structured or unstructured data , which comes from various sources, such as the internet. The data can be transformed using Logstash's filter option, which has different plugins to play with different sets of data. For example, if we get an IP address in our data, the GeoIP plugin can add geolocation using that IP address, and in the output, we can get additional information of geolocation, which can then be used in Kibana to plot a map.
The following expression shows us an example of a Logstash configuration file:
input 
{
file
{
path => "/var/log/apache2/access.log"
}
}
filter
{
grok
{
match => {message => "%{COMBINEDAPACHELOG}"}
}
}
output
{
elasticsearch
{
hosts => "localhost"
}
}
In the preceding expression, we have three sections: input, filter, and output. In the input section, we're reading the Apache access log file data. The filter section is there to extract Apache access log data in different fields, using the grok filter option. The output section is quite straightforward as it's pushing the data to the local Elasticsearch cluster. We can configure the input and output sections to read or write from or to different sources, whereas we can apply different plugins to transform the input data; for example, we can mutate a field, transform a field value, or add geolocation from an IP address using the filter option.

Grok is a tool that we can use to generate structured and queryable data by parsing unstructured data.

Kibana

In Elastic Stack, Kibana is mainly used to provide the graphical user interface, which we use to do multiple things. When Kibana was first released, we just used it to create charts and histograms, but with each update, Kibana evolves and now we have lots of killer features that make Kibana stand out from the crowd. There are many features in Kibana, but when we talk about the key features, they are as follows:
  • Discover your data by exploring it
  • Analyze your data by applying different metrics
  • Visualize your da...

Table of contents

  1. Title Page
  2. Copyright and Credits
  3. Dedication
  4. About Packt
  5. Contributors
  6. Preface
  7. Introducing Kibana
  8. Getting Data into Kibana
  9. Exploring Data
  10. Visualizing Data
  11. X-Pack with Machine Learning
  12. Monitoring Applications with APM
  13. Kibana Advanced Tools
  14. Other Books You May Enjoy